Corn: The Structure of a Bullish Market


January 4, 2007
BY Darin Newsom
As harvest winds down for another year and the corn crop gets tucked away for a long winter's nap, one can't help but wonder what type of market situation we might all wake up to next spring.
In my almost 20 years of studying commodity markets, I can honestly say I have never seen a market with as bullish a structure as corn at this time (early December). This means the uptrend in price going on in the corn market has the support of both sides of the market—the commercial (those involved in the cash market of the commodity) and noncommercial (speculative) traders. The high prices seen this fall could have some staying power and be a precursor of long-term changes in price expectations to come.
Understanding the structure of the market is central to answering the most important question faced by analysts: What type of market exists? This is far different than the question most try to answer: Where is the market going? Due in large part to the "chaos theory" (sometimes called the "Butterfly Effect"), where small changes in variables at a critical point can create large changes, trying to predict the process is like trying to nail Jell-O to a wall—both impossible and pointless.
The first piece of the structure puzzle is the trend that prices are moving in a given market. When I talk about trend, I am not proposing in-depth technical analysis, but a good understanding of the direction of price changes over time. By definition, the trend is nothing but the general consensus of all market participants—regardless of size—with respect to the price of the market over time. Therefore, a simple look at what direction prices are generally moving provides insight into the outlook of the traders in the market.
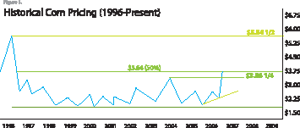
The corn market (figure 1) is in a strong uptrend with the front-month contract moving into price levels not seen since 1996. Simply put, this means that, for whatever reason, market participants continue to see upside potential in this market, pushing contracts higher.
Of these market participants, the group that carries the most weight in regards to direction is the noncommercial trader. This classification has gone through a transformation in recent years and can no longer be thought of as just the commodity fund traders of the past. It's now made up of large international investors with a seemingly unending supply of capital to put into the marketplace.
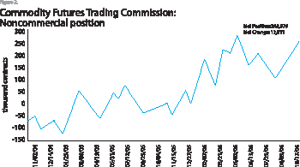
These traders remain bullish on the corn market, holding a net-long futures position of almost 250,000 contracts in mid-November 2006 (figure 2). However, in a departure from years gone by, this group's position is long-term instead of short-term. In other words, it hasn't only built a substantial net-long futures position in the nearby contracts as had been the practice of commodity funds of old, but also in far deferred contracts as well. This means it has a base position established in the back month 2006-2007 marketing year contracts as well as the 2007-2008 marketing year contracts, providing long-term support to the market.
This type of position strength by this key group of traders is important in establishing an uptrend. As illustrated by the collapse of the 2006 crude oil market despite the net-long position of noncommercial traders, the ability to maintain this trend lies with the real underlying fundamentals (i.e., supply and demand characteristics) of a particular market.
I differentiate between "real" and "known" to illustrate the fundamentals at work in the marketplace and those that only reflect what has occurred. "Known" fundamentals are those found in government reports (USDA, U.S. DOE, etc.) and reworked by private analytical groups. These numbers reflect a supply and demand situation that existed in the past—a week ago, two weeks ago, a month ago, etc.—and have already been digested by the market and reflected in the price history of the commodity. So the use or analysis of these numbers in developing a market strategy is like driving down the freeway backwards using only your rearview mirror for visual guidance.
The "real" fundamentals are what can be seen every day in the market action and show the commercial trader's opinion of the current underlying supply and demand situation. The commercial outlook is indicated through the price spreads between the various contracts as traders account for still-unknown supply and demand factors that the market is in the process of digesting and the effect, either bullish or bearish, that these factors have on the market outlook.
The structure of these price spreads usually reflects a certain portion of the cost of carrying the commodity in storage, meaning that deferred contract prices are higher than nearby contract prices. The wider the futures spreads—or in other words the higher the percent of full commercial carry (the total cost of storing the commodity over time)—the more bearish the underlying fundamentals.
For example, December corn is trading at $3.50 per bushel, while the March contract is trading at $3.65 per bushel. If the total commercial cost of storage for 30 days is just over 6 cents per bushel and it's 90 days from the beginning of December through the end of February (the time frame covered by the March contract), then the cost of full commercial carry would be about 19.25 cents.
The March futures contract trading 15 cents over the December price reflects the commercial trader's willingness to pay someone about 78 percent (15 cents versus 19.25 cents) of the total cost of storage to not sell grain right now. In other words, they have plenty of supply to meet demand and want to buy the corn at a later date. Therefore, the higher the percent of full commercial carry, the more bearish the supply and demand situation of that commodity.
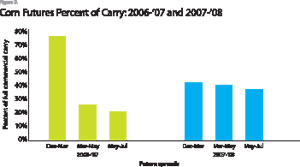
However, the opposite situation exists in the long-term outlook of the corn market for both 2006-2007 and 2007-2008 (figure 3). In mid-November, the nearby futures spread did indeed reflect a short-term bearish supply and demand situation by trading at about 75 percent of full commercial carry. The March to May 2007 spread was trading at about 25 percent, while the May to July 2007 spread was trading near 20 percent. This indicates an increasingly bullish supply and demand situation the further into the 2006-2007 marketing year we look (i.e., the longer one holds the grain, the less percentage of costs commercial traders are willing to pay in hopes of creating cash sales).
Furthermore, the 2007-2008 contracts reflected 42 percent, 40 percent and 37 percent of full commercial carry, respectively. The narrowness of these deferred futures spreads would indicate that this market may be in the process of a long-term redrawing of price expectations.
That is due to the one economic rule that I remember from my college days: A change in supply creates a short-term change in price, while a change in demand can create a long-term change in price. Think of it this way: A normal weather market creates a fear of decreased supply leading to a price spike. When harvest occurs or the next marketing season rolls around, the threat to supply is usually gone and prices return to their historic trading range. In the case of a demand change, however, supplies don't quickly rebuild and that leads to continued pressure in the market to push prices higher in hopes of rationing the commodity or slowing demand. Once this cooling of demand occurs, the market usually finds itself at a higher price plateau, only returning to the previous price range if adequate supplies can be created by replacement or alternative commodities.
The corn market is in an incredibly bullish situation, driven in large part by an actual change in long-term demand and investors speculating that historic price ranges are just that—history. The structure of the futures spreads indicates that obtaining or maintaining cash ownership of adequate supplies could be difficult and that this rally, unlike those seen in other commodities or in supply-driven rallies of the past, may create a whole new price plateau that could stand for years to come.
Darin Newsom is DTN's senior analyst, and has almost 20 years of experience in analyzing commodity markets and developing risk management strategies. His hybrid approach to analysis and market commentary has made him a frequent contributor to various media outlets and organizations. Reach him at darinnewsom@dtn.com or (800) 328-2278.
In my almost 20 years of studying commodity markets, I can honestly say I have never seen a market with as bullish a structure as corn at this time (early December). This means the uptrend in price going on in the corn market has the support of both sides of the market—the commercial (those involved in the cash market of the commodity) and noncommercial (speculative) traders. The high prices seen this fall could have some staying power and be a precursor of long-term changes in price expectations to come.
Understanding the structure of the market is central to answering the most important question faced by analysts: What type of market exists? This is far different than the question most try to answer: Where is the market going? Due in large part to the "chaos theory" (sometimes called the "Butterfly Effect"), where small changes in variables at a critical point can create large changes, trying to predict the process is like trying to nail Jell-O to a wall—both impossible and pointless.
The first piece of the structure puzzle is the trend that prices are moving in a given market. When I talk about trend, I am not proposing in-depth technical analysis, but a good understanding of the direction of price changes over time. By definition, the trend is nothing but the general consensus of all market participants—regardless of size—with respect to the price of the market over time. Therefore, a simple look at what direction prices are generally moving provides insight into the outlook of the traders in the market.
The corn market (figure 1) is in a strong uptrend with the front-month contract moving into price levels not seen since 1996. Simply put, this means that, for whatever reason, market participants continue to see upside potential in this market, pushing contracts higher.
Of these market participants, the group that carries the most weight in regards to direction is the noncommercial trader. This classification has gone through a transformation in recent years and can no longer be thought of as just the commodity fund traders of the past. It's now made up of large international investors with a seemingly unending supply of capital to put into the marketplace.
These traders remain bullish on the corn market, holding a net-long futures position of almost 250,000 contracts in mid-November 2006 (figure 2). However, in a departure from years gone by, this group's position is long-term instead of short-term. In other words, it hasn't only built a substantial net-long futures position in the nearby contracts as had been the practice of commodity funds of old, but also in far deferred contracts as well. This means it has a base position established in the back month 2006-2007 marketing year contracts as well as the 2007-2008 marketing year contracts, providing long-term support to the market.
This type of position strength by this key group of traders is important in establishing an uptrend. As illustrated by the collapse of the 2006 crude oil market despite the net-long position of noncommercial traders, the ability to maintain this trend lies with the real underlying fundamentals (i.e., supply and demand characteristics) of a particular market.
I differentiate between "real" and "known" to illustrate the fundamentals at work in the marketplace and those that only reflect what has occurred. "Known" fundamentals are those found in government reports (USDA, U.S. DOE, etc.) and reworked by private analytical groups. These numbers reflect a supply and demand situation that existed in the past—a week ago, two weeks ago, a month ago, etc.—and have already been digested by the market and reflected in the price history of the commodity. So the use or analysis of these numbers in developing a market strategy is like driving down the freeway backwards using only your rearview mirror for visual guidance.
The "real" fundamentals are what can be seen every day in the market action and show the commercial trader's opinion of the current underlying supply and demand situation. The commercial outlook is indicated through the price spreads between the various contracts as traders account for still-unknown supply and demand factors that the market is in the process of digesting and the effect, either bullish or bearish, that these factors have on the market outlook.
The structure of these price spreads usually reflects a certain portion of the cost of carrying the commodity in storage, meaning that deferred contract prices are higher than nearby contract prices. The wider the futures spreads—or in other words the higher the percent of full commercial carry (the total cost of storing the commodity over time)—the more bearish the underlying fundamentals.
For example, December corn is trading at $3.50 per bushel, while the March contract is trading at $3.65 per bushel. If the total commercial cost of storage for 30 days is just over 6 cents per bushel and it's 90 days from the beginning of December through the end of February (the time frame covered by the March contract), then the cost of full commercial carry would be about 19.25 cents.
The March futures contract trading 15 cents over the December price reflects the commercial trader's willingness to pay someone about 78 percent (15 cents versus 19.25 cents) of the total cost of storage to not sell grain right now. In other words, they have plenty of supply to meet demand and want to buy the corn at a later date. Therefore, the higher the percent of full commercial carry, the more bearish the supply and demand situation of that commodity.
However, the opposite situation exists in the long-term outlook of the corn market for both 2006-2007 and 2007-2008 (figure 3). In mid-November, the nearby futures spread did indeed reflect a short-term bearish supply and demand situation by trading at about 75 percent of full commercial carry. The March to May 2007 spread was trading at about 25 percent, while the May to July 2007 spread was trading near 20 percent. This indicates an increasingly bullish supply and demand situation the further into the 2006-2007 marketing year we look (i.e., the longer one holds the grain, the less percentage of costs commercial traders are willing to pay in hopes of creating cash sales).
Furthermore, the 2007-2008 contracts reflected 42 percent, 40 percent and 37 percent of full commercial carry, respectively. The narrowness of these deferred futures spreads would indicate that this market may be in the process of a long-term redrawing of price expectations.
That is due to the one economic rule that I remember from my college days: A change in supply creates a short-term change in price, while a change in demand can create a long-term change in price. Think of it this way: A normal weather market creates a fear of decreased supply leading to a price spike. When harvest occurs or the next marketing season rolls around, the threat to supply is usually gone and prices return to their historic trading range. In the case of a demand change, however, supplies don't quickly rebuild and that leads to continued pressure in the market to push prices higher in hopes of rationing the commodity or slowing demand. Once this cooling of demand occurs, the market usually finds itself at a higher price plateau, only returning to the previous price range if adequate supplies can be created by replacement or alternative commodities.
The corn market is in an incredibly bullish situation, driven in large part by an actual change in long-term demand and investors speculating that historic price ranges are just that—history. The structure of the futures spreads indicates that obtaining or maintaining cash ownership of adequate supplies could be difficult and that this rally, unlike those seen in other commodities or in supply-driven rallies of the past, may create a whole new price plateau that could stand for years to come.
Darin Newsom is DTN's senior analyst, and has almost 20 years of experience in analyzing commodity markets and developing risk management strategies. His hybrid approach to analysis and market commentary has made him a frequent contributor to various media outlets and organizations. Reach him at darinnewsom@dtn.com or (800) 328-2278.
Advertisement
Advertisement
Upcoming Events


