Cost of Operations: ULSD vs. B20
May 13, 2011
BY David M. Nelson, Mark Vonderembse, S. Subba Rao and Stephen Atkinson
Mass transportation, energy conservation and cost reduction are global issues. Many, if not all, major cities and transport authorities seek less dependence on foreign oil and new technologies such as hybrid-electric transport and biofuels. While pursuing these, they can also address global warming by reflecting on a broad perspective of issues such as energy conservation and waste reduction, in addition to products with longer life cycles and reduced carbon footprints. For transit authorities, one of the primary focuses is fuel.
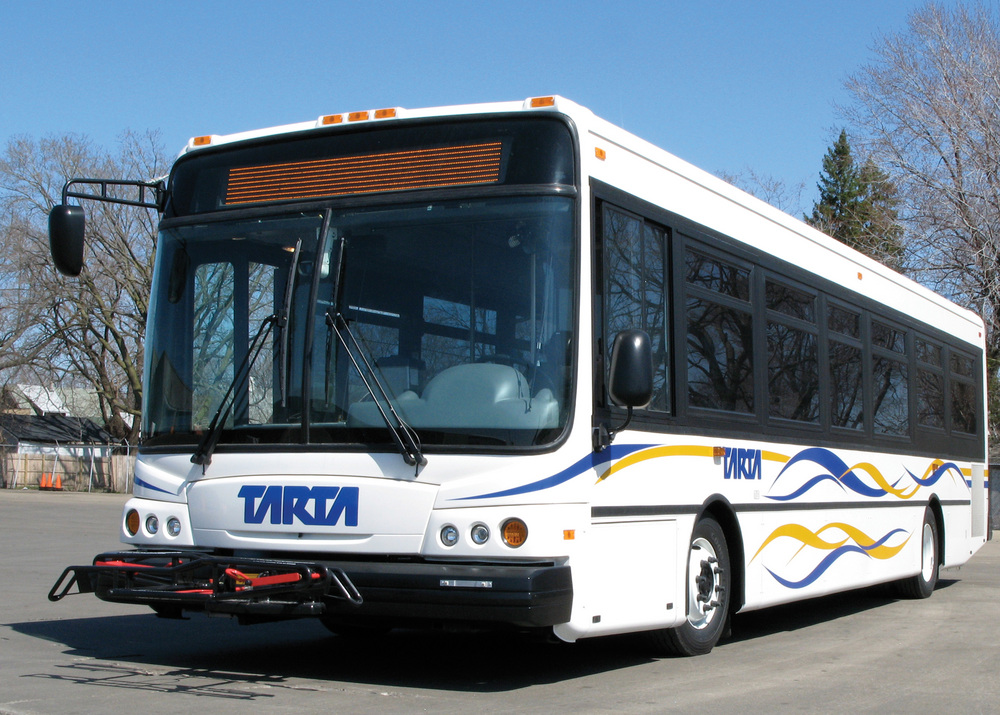
In Toledo, Ohio, transport vehicles at the Toledo Area Regional Transit Authority utilize two types of diesel fuel. One is conventional ultra-low sulfur diesel fuel (ULSD), and the other is a B20 blend, or 20 percent biodiesel mixed with 80 percent conventional ULSD. Use of either of these fuels has benefits as well as drawbacks. For example, in comparison to conventional diesel fuel, biodiesel has its benefits, such as helping lessen dependence on foreign oil while achieving reductions of adverse environmental effects such as hydrocarbon emissions.
However, there are also disadvantages with the use of biodiesel. Increased nitrogen oxide vehicle emissions, as well as higher fuel costs, were found when compared to conventional diesel fuel. The added cost of biodiesel is due to increased processing requirements above and beyond that of conventional diesel fuel, often found in more labor and transport costs.
There are also other ways of comparing the costs of both fuels. In order to explore the differences in use of B20 and ULSD, an internal segment reflecting life-cycle cost (LCC) was selected. These costs typically represent all projected fees associated with a product throughout its lifespan. In this study, the fuel use costs were investigated, including price of fuel, vehicle wear and maintenance. To compare the entire array of costs throughout the life cycle of the vehicles in the TARTA fleet is beyond the scope of this paper. To facilitate comparison, after discussing the study with TARTA management, it was believed that feasible cost results could be found by looking at interdepartmental segments within the transport agency. To accomplish this, LCCs of the departments selected were then partitioned into operational segments. The newest vehicles in the fleet, Blue Bird buses, were selected for testing. These vehicles represent the ones scheduled to replace the older buses. Vehicles in the study were found to historically have 30-year life spans. Consequently, this was the life-cycle length assigned to them.
Advertisement
Advertisement
The economic performance of alternative fuels used in buses can be measured by comparing the projected total cost of operating a bus fleet during the transport vehicle’s projected 30-year life. Product unit costs were selected, which are referred to as internalized operations. Costs are one of the primary indicators of how viable a product or service is when comparing the potential for longevity. Vehicle LCCs were selected for buses operating on either ULSD fuel or B20 fuel in the TARTA fleet.
LCC analysis is important for investment since accurate projection of the total cost of products and services is very important for businesses to survive. During the recent prolonged recession, companies have been impacted by a reduction of purchasing power in tandem with rising inflation. Given this, many firms seek instruments for investing that will result in the least cost with highest profit margin. A variety of methods for cost comparison have been developed and utilized over time. Some of these are given below, and one of them was selected for use in this study.
Cost-Benefit Analysis: CBA compares two categories, the total expected cost and the total projected benefits, in order to determine the most optimal selection of time, material, equipment and other cost issues. In this type of analysis, the costs and benefits are monetary, with adjustments for the time value of money so that all benefits and costs over time are represented in terms of their present value (PV). Time value is a term that reflects the specific value of money at a designated point. Since the buses typically have 30-year life spans, a CBA can be used for comparison. For this study, a discount rate is selected for computing all projected future costs and benefits in present value.
Calculations of CBA typically encompass the time value of money which is generated by converting the future expectations of both costs and benefits into a present value amount. In practice, CBA tries to compare “apples to apples” by putting all pertinent costs and benefits on the same level. A discount rate is then chosen, which is then used to compute all relevant future costs and benefits in present-value terms.
Discounted Cash Flow: DCF represents some of the logic utilized in CBA. It reflects the amount a group of investors is willing to pay today in order to receive the anticipated cash flow in the future. This is found by converting future earnings to today’s money. With this information, the future (projected) cash flow is then discounted in order to determine the value of a project, such as the comparison of diesel and biodiesel fuels in this study.
Advertisement
Advertisement
Net Present Value: NPV is related to the total PV of a time series of cash flows. It is a standard method for using the time value of money to appraise long-term projects. The NPV of an income stream is the sum of the present values of all contributions from the stream. This is useful in comparing various alternatives. For example, the net present value of an investment could be illustrated in comparing two potential revenue options; either that from a projected investment, or interest gains from loans. For this study, it was decided to reflect on NPV with the discounted value formula for analysis of LCCs in order to determine which option provides the best alternative. The time frame for the base year utilized was the second year of the TARTA study from June 2007 through May 2008.
To achieve feasible results within the time frame allotted, boundaries were defined based on internal departments in TARTA, and metrics from the literature. A one-year time frame offers insight into the cost segment selected for the study. The internal operations department selections were as follows: administrative services/field support services (supervisor labor, bus operator, reception operator); marketing services (all pertinent labor, support materials, supplies, information technology and advertising); bus alteration for biodiesel (all pertinent labor, modification, components); refueling (fuel); maintenance and repair (planned, engine rebuilding, repair, insurance, and loss of ridership); and infrastructure overhead (utilities such as heating, cooling, sewer, gas and electric, maintenance, supplies and support materials).
Cumulative results were based on discounted present value amortizing (30-year) internal operations cost from vehicle data for Blue Bird buses. Results show the average annual biodiesel cost at $280,930, whereas the average annual cost of ULSD was $229,070. Based on this analysis, it was found that use of 20 percent biodiesel fuel in Blue Bird buses cost 22.6 percent more than that of ULSD.
While this seems to be a sizeable increase in costs, it is important to note that this cost represents only the internalized operations, and not all costs incurred over the entire product life cycle. There are also other factors to consider when reflecting on whether to use conventional diesel or B20 biodiesel.
Adverse effects of pollution, for example, may be an important issue. Also, due to the current administration’s focus on alternative energy support, along with growing economy of scale in fuel production, an end result could be that biodiesel fuel becomes more affordable to purchase over time. Ultimately, factors other than cost alone must be considered when evaluating whether to pursue this type of alternative energy.
Authors: David M. Nelson, Mark Vonderembse, S. Subba Rao and Stephen Atkinson
University of Toledo, TARTA (Atkinson)
(734) 662-1627
nels.4@comcast.net
Upcoming Events


