FutureMetrics provides new dashboard based on Clean Power Plan

Future Metrics
December 22, 2015
BY Katie Fletcher
On Dec. 21, FutureMetrics released a new dashboard, which shows state specific information as it pertains to compliance with the Clean Power Plan and estimates pellet demand if some of the selected states' coal power stations cofire pellets in order to lower CO2 emissions.
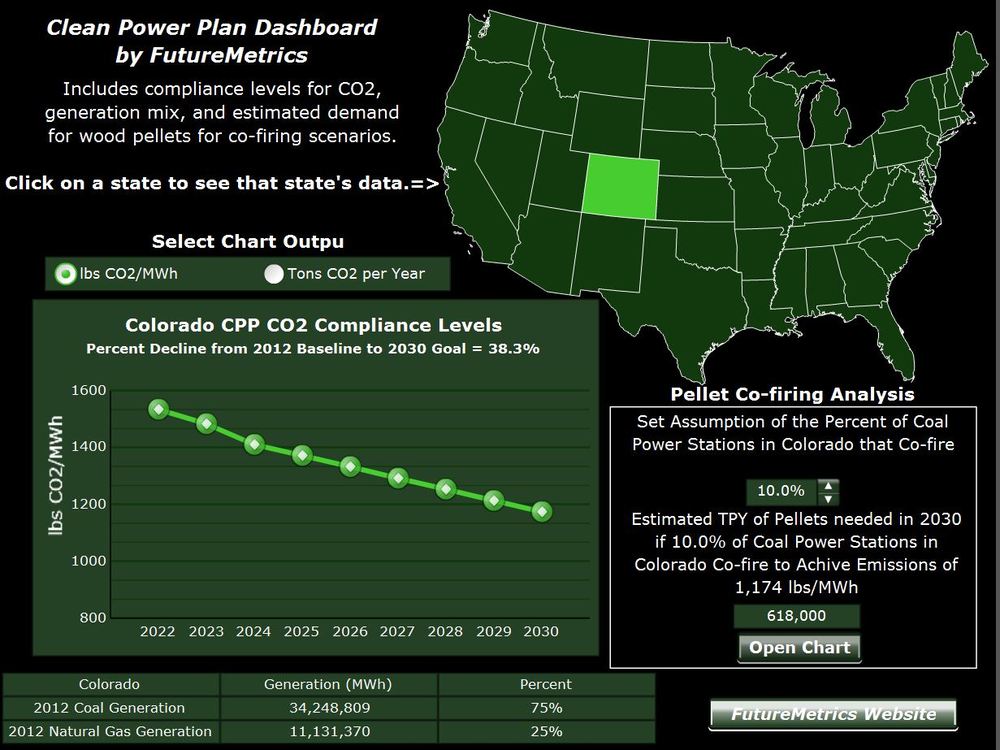
The main window of the dashboard has a chart that shows the levels of CO2 in either pounds per megawatt hour (MWh) or total tons of CO2 based on the CPP compliance level goals from 2022 to 2030 for the selected state. The chart also shows the reduction in CO2 emissions as a percentage from the 2012 baseline for the selected state. For example, Colorado’s CO2 rate in 2022 is 1,534 pounds per MWh and in 2030 1,174 pounds of CO2 per MWh. Colorado’s decline from the 2012 baseline to 2030 goal is 38.3 percent.
In addition, the main window shows the baseline coal and natural gas generation mix in 2012 for the selected state that the EPA used to set CO2 reduction goals. Colorado’s 2012 coal generation was roughly 34 million MWh or 75 percent. Natural gas generation in 2012 was approximately 11 million MWh or 25 percent.
Advertisement
Advertisement
The dashboard’s main window allows the user to see the estimated pellet tonnage that would be used in cofiring in the year 2030 if a proportion of coal power plants in that state met its CO2 reduction goals. The proportion is set at 10 percent of the pulverized coal plants in the state but can be changed by the user.
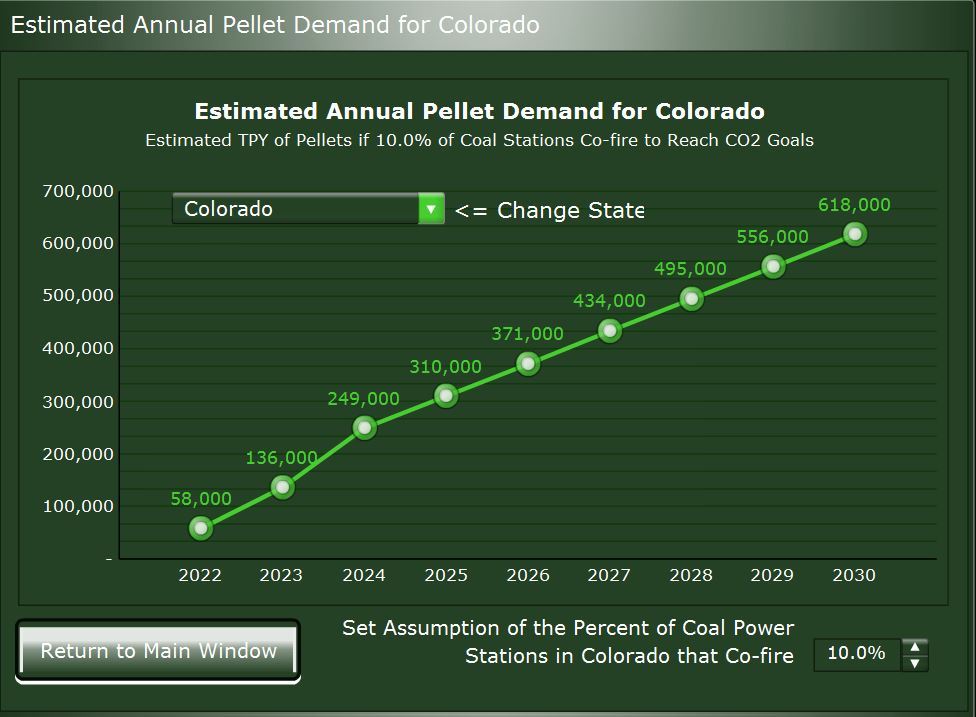
The pellet cofiring analysis has a link to a pop-up window of a chart showing the estimated number of tons of pellets for each year from 2022 to 2030 for the selected state. The pellet demand estimates are based on each state's expected CO2 emissions in 2022 and the further reductions needed to meet the 2030 targets that can be achieved by cofiring pellets with coal. The proportion of pulverized coal plants cofiring in the state also determines the demand for pellets. The estimated tons of pellets per year demanded in 2030 if 10 percent of coal power stations in Colorado cofire to achieve emissions of 1,174 pounds per MWh is 618,000 tons.
The dashboard utilizes data from the U.S. EPA. The EPA assumes that CO2 emissions will fall from the baseline year 2012 to the CPP implementation year in 2022 via a loss in coal generation replaced by natural gas generation and by increases in intermittent renewable generation from wind and solar.
The newest dashboard on the Clean Power Plan can be downloaded here.
Advertisement
Advertisement
This dashboard follows a white paper released at the end of November offering a critique of Climate Central’s recent “Pulp Fiction” story, a three-part special report by John Upton that criticizes the use of wood pellets.
Another related dashboard available on the FutureMetrics website is a cofiring wood pellets and coal dashboard. The dashboard allows the user to enter various points of data about a coal power plant, as well as pellets to determine the increased cost per kilowatt hour from cofiring and the CO2 reduction from cofiring.
Upcoming Events


