UK DBEIS publishes Q2 2016 energy statistics

U.K. Department of Business, Energy & Industrial Strategy
October 6, 2016
BY Katie Fletcher
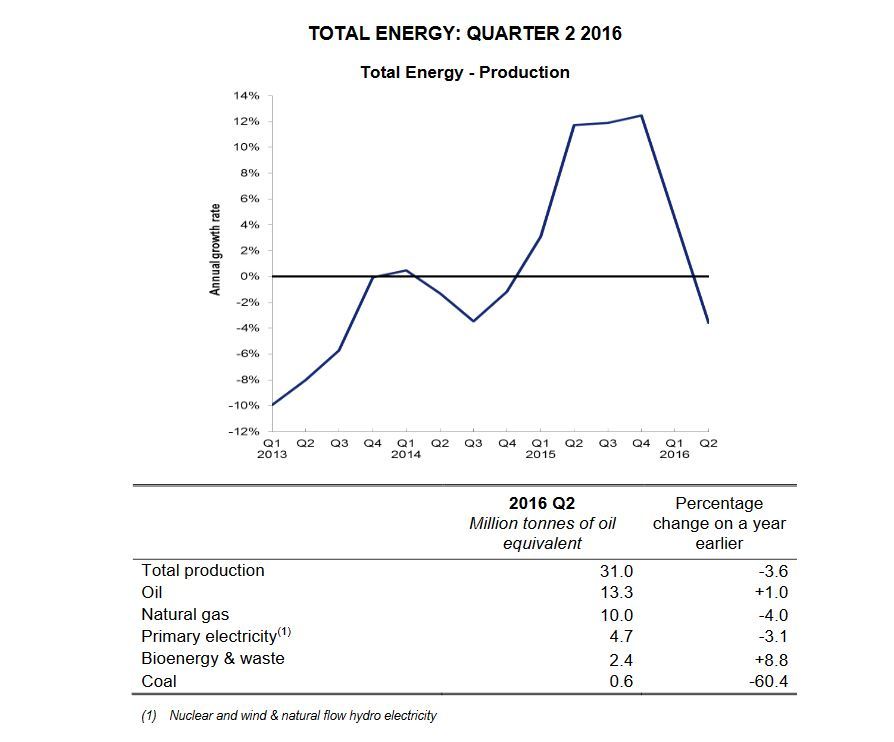
The Department for Business, Energy & Industrial Strategy recently published Energy Trends and Energy Prices publications, covering new data for the second quarter of 2016. Overall, total energy production fell 3.6 percent in the second quarter to 31 million metric tons of oil equivalent, compared to the same period in 2015. Bioenergy and waste production saw the largest percentage change on a year earlier, increasing 8.8 percent to 2.4 million metric tons of oil equivalent of total energy production.
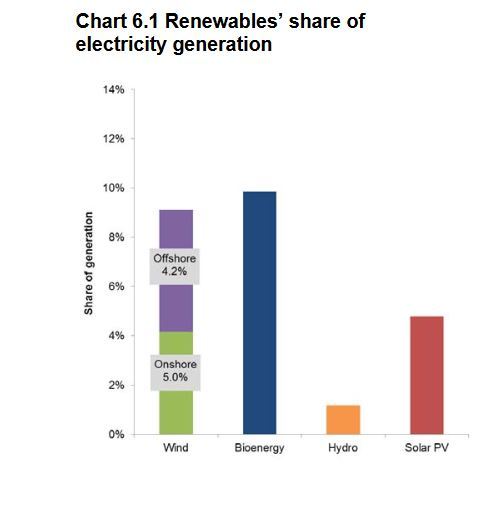
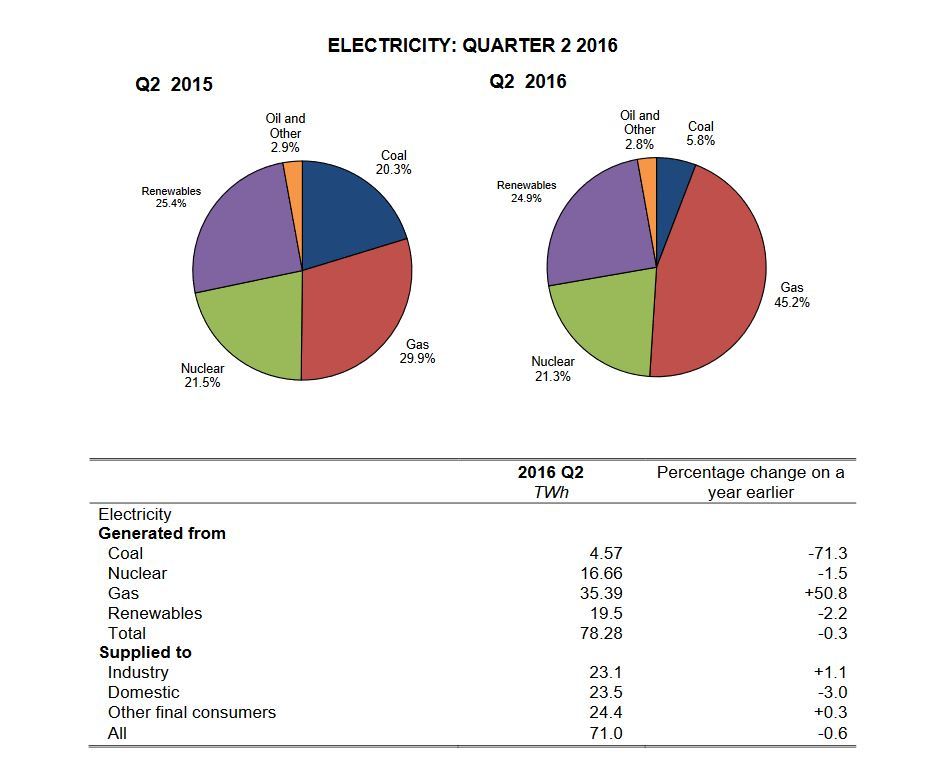
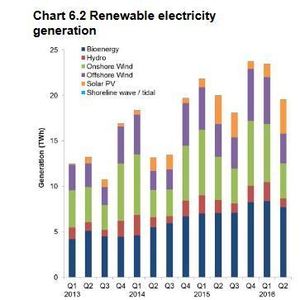
Primary electricity output in Q2 2016 was 3.1 percent lower than in 2015 second quarter. The only positive percentage change on a year earlier was with electricity generated from gas. Of electricity generation, renewables share (including hydro, wind and other renewables) fell slightly from 25.4 percent in 2015 Q2 to 24.9 percent in this year’s second quarter. Renewable electricity generation was 19.5 terawatt hours (TWh) in the second quarter of 2016, which was a few percentage points lower than the 20 TWh reported in the comparable period in 2015. Bioenergy showed the highest absolute increase in generation by 9.2 percent from 7.1 TWh in the second quarter of 2015 to 7.7 TWh in Q2 of this year, mainly contributed to increased biomass generation from the conversion of a third unit at Drax to high-range cofiring. Bioenergy had a 40 percent share of generation in the second quarter of 2016.
Renewable electricity capacity was 32.5 gigawatts (GW) at the close of 2016 quarter two, a 14 percent increase from 3.9 GW on a year earlier. By the end of 2016 Q2, 5.33 GW of capacity had been installed and eligible for the Feed in Tariff (FiT) scheme, an increase of 30 percent on a year earlier and constituting approximately 16 percent of all installed renewable capacity.
The renewable electricity load factor for bioenergy was down 2.6 percentage points in quarter two of 2016, at 64 percent, due to a number of biomass sites shutdown for maintenance during the quarter.
Advertisement
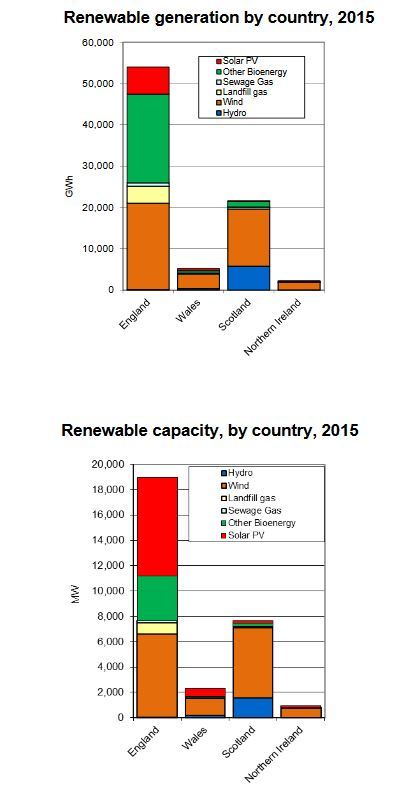
Also published in the Energy Trends report is a special feature of renewable electricity in Scotland, Wales, Northern Ireland and the regions of England in 2015. At the end of 2015, England had 62 percent of U.K. capacity, more than double Scotland’s 25 percent. Likewise, England represented the highest share of bioenergy with 65 percent of U.K. generation, whereas Scotland had 26 percent. The location of the three 645 MW units of Drax power station made the English regions of Yorkshire and Humber have the largest share of both capacity (19 percent) and generation (31 percent).
An increase of 16 percent (0.1 GW) in capacity was reported in Northern Ireland, with wind, solar PV and bioenergy equally contributing one-third, and the region increased its generation 32 percent or 0.5 TWh. Scotland capacity rose by 5.1 percent (0.4 GW), mainly contributed to new wind capacity. Generation also rose by 14 percent or 2.6 TWh, with 2.1 TWh of this coming from wind. Wales experienced an increase of 26 percent or 0.5 GW in capacity, with around half from solar PV. Two-thirds of its generation came from wind, which increased 54 percent to 1.8 TWh. These regional trends showed that 91 percent of the U.K. generation from sewage and 91 percent of the U.K. generation from other bioenergy (including that used for cofiring) took place in England.
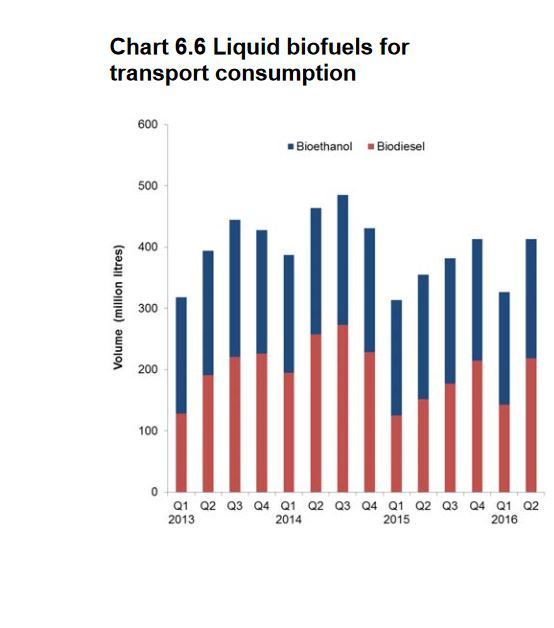
According to the Energy Trends report, liquid biofuels increased by 16 percent, and represented 3.4 percent (by volume), 413 million liters, of petrol and diesel consumed in road transport during the second quarter of 2016. Biodiesel contributed the largest share of biofuels consumption with 53 percent and bioethanol represented 47 percent of biofuels consumption. Overall, production of petroleum products in Q2 of 2016 was raised 7.3 percentage points compared to the same period in 2015. Primary demand for petroleum products was 4.2 percent higher in 2016 quarter two compared to last year, and the sales of motor spirit (unleaded, including biofuels) only decreased by 0.4 percent in the second quarter of 2016, while sales of DERV (diesel, including biofuels) increased by 2.9 percent.
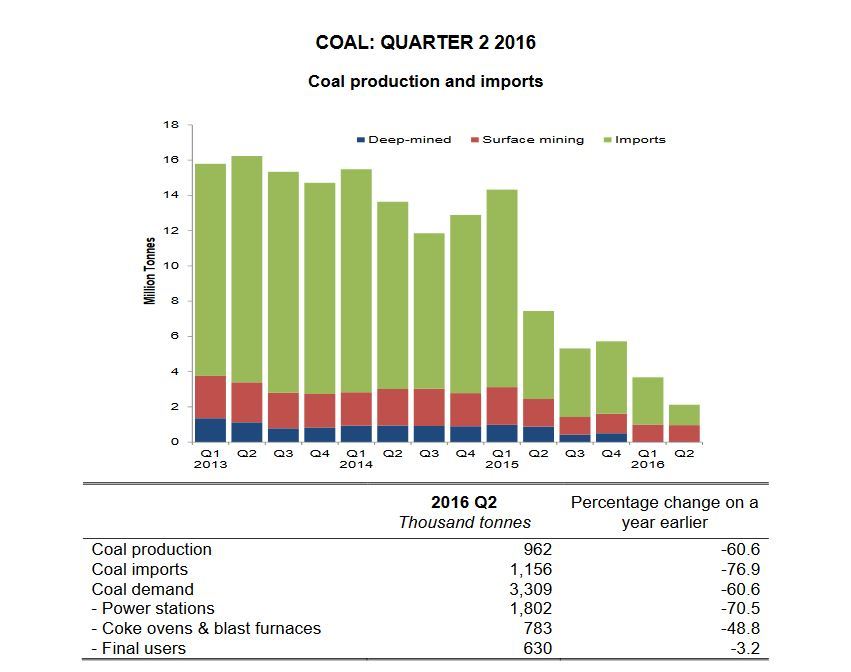
Coal has continued its steady decline in Q2 of 2016, falling 61 percent since quarter two of 2015 due to mines closing and a cutback in production at other mines as they were ending operations. Coal production is now at a record low in the U.K. at around 1 million metric tons, and imports of coal in the second quarter of 2016 were at 1.2 million metric tons, a decrease of 77 percent compared to 2015 Q2, due to low demand. Total demand for coal in the second quarter of 2016 was 3.3 million metric tons, down 61 percent from the second quarter in the prior year. Consumption by electricity generators also reached a new record low of 1.8 million metric tons, down 71 percent during quarter two 2016 compared to the second quarter last year.
As for total primary energy consumption, DBEIS reported it fell less than 1 percent, however when adjusted to take account of weather differences between the second quarter of 2015 and 2016, it decreased 2.1 percent, to bring total inland consumption on a primary fuel input basis to 190.2 million metric tons of oil equivalent, continuing the downward trend. Primary electricity consumption fell 3 percent.
Advertisement
Final energy consumption, excluding non-energy use, was 1.7 percent higher in the second quarter of 2016 than in quarter two of 2015. On a temperature-corrected basis, final energy consumption was up 3.1 percent. Inland energy consumption of bioenergy and waste was 13.8 million metric tons of oil equivalent in the second quarter of 2016, a 14.5 percent increase from a year earlier.
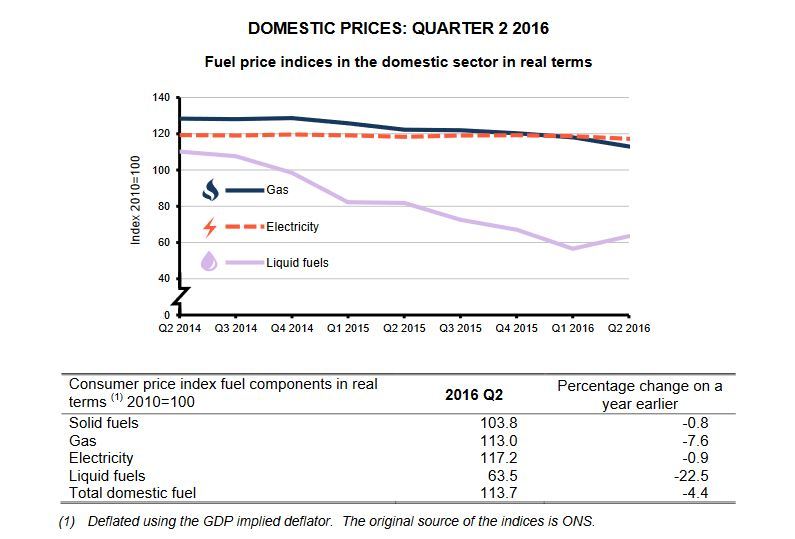
As for pricing, average industrial electricity prices were 5.1 percent lower, including the average climate change levy (CCL) in real terms and 6.5 percent lower excluding CCL in real terms, in quarter two 2016 in comparison to quarter two of the prior year. Domestic electricity prices, including VAT, in the second quarter of this year were 0.9 percent lower in real terms than in 2015 Q2. The price of liquid fuels fell by 22 percent from quarter two of last year to this year, but between quarter one of 2016 and the second quarter, the price increased by 12 percent.
These DBEIS publications follow Energy Trends and Energy Prices publications for the first quarter, which were released in July, and Digest of U.K. Energy Statistics 2016 released in August.
Upcoming Events


