Utility Management Provides Savings


February 15, 2011
BY Jaron Vande Hoef
Since you cannot effectively manage what you do not measure, the most logical place to begin managing energy use is to implement a utility metering and monitoring system. The U.S. DOE’s Industrial Technologies Program has recorded many cases of 20 percent energy savings in facilities in the food processing, cement manufacturing, brewery and corn processing industries. Achieving 20 percent energy savings may seem daunting, but like any other overwhelming project, it helps to have a solid reference point to begin.
Utility management tools enable intelligent analysis of energy data and often provide a dashboard-type view of a facility’s entire electrical system and piped utility system. One can track and allocate energy usage, which in turn helps reduce utility bills by avoiding peaks in energy usage. It also provides early detection of power quality problems and enables capacity planning and maintenance. Finally, the data provides important information on trends used to troubleshoot potential issues.
The greatest benefit of utility metering and monitoring equipment is that it puts users in a proactive position. Today's meters and power monitors capture events, provide historical trending data, and can even provide control functions to alarm the system operator or possibly trigger automated responses to certain energy data points. Long-term metering provides facility owners with a map of load changes, allowing them to track daily, weekly and seasonal variations, as well as discern long-term trends. In addition, owner metering provides a comparison base to validate utility billing, and for identifying money-saving opportunities on electric bills.
Utility costs are a major business expense and while management systems also require expenditures, a study by the Energy Cost Savings Council revealed meters and monitors have an average payback period of less than six months and an average return on investment of 200 percent when appropriate action is taken to manage the energy costs that are being measured once the meters and monitors are installed.
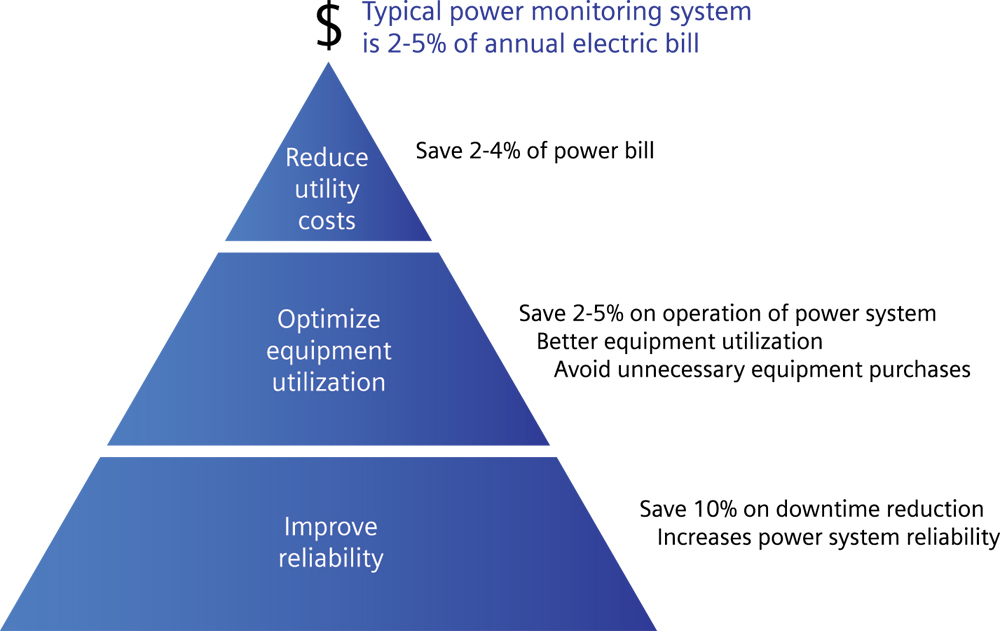
An iceberg analogy illustrates utility cost savings. When people view an iceberg, all they see are huge peaks rising above the water. In reality, most of an iceberg is under the water. Utility cost savings can be viewed the same way. Think of a utility bill as the peak that is easy to see each month. With a utility management system, you could realize a 2 to 4 percent savings in utility bills—the tip of the iceberg in terms of potential savings. The majority of savings is derived by looking beyond a utility bill, or below the surface. An additional 2 to 5 percent can be saved through better equipment utilization and avoiding unnecessary capital purchases. Another 10 percent can be realized by improving power system reliability.
Identify Root Causes, Opportunities
Advertisement
Advertisement
Utility data can help isolate inefficiencies or changes in energy consumption and relate them to everyday business processes. From a higher level, one can drill down to deeper levels of detail to understand what is driving the performance. For example, one facility discovered an unexpected $20,000 increase in its utility bill. Fortunately, utility metering was in place that revealed the source of the excessive usage—a chiller was running at full load all day. With no automatic setbacks in the chiller controls, operators neglected to make adjustments. To prevent this from recurring, the facility added an automation program to control the chiller to optimize energy performance.
Access to data allows managers to view energy use and costs by organizing and aggregating consumption data by time of use, production volume or other drivers. Aggregating energy consumption by shifts may uncover differences in efficiency from one shift to the next. Detecting and analyzing sudden spikes in energy could indicate pending equipment failure, or identify sustained changes that may be the result of equipment replacement.
An ethanol plant depends on continuity of power, affecting everything from computers to controls and motors. The aggregate cost of power quality events for continuous-process manufacturers is estimated at $300 million each year. Monitor elements such as run-time, voltage, frequency, fuel levels, pressures and temperatures to determine stresses on generators, transformers and other components throughout the facility infrastructure.
Utility management system capabilities range from operational-level software to enterprise solutions that can consolidate and analyze all consumed energy types across all geographical locations through a single, unified interface. To allow for accurate comparisons, the system would automatically convert measurements for each utility type to common units such as Btu. For example, a producer could integrate metering of electricity, water, air, gas and steam and then correlate the electrical and piped utility data. This information can be combined with temperature and humidity readings to calculate and optimize system efficiency.
System Components
Data provided by a utility management system is the result of multiple components working together. Physical components, data acquisition hardware and software work together to provide functional data.
Physical components include items such as power meters, water meters (incoming and outgoing), gas meters, and compressed air header-pressure transmitters. These meters use a variety of output signals including analog (4-20mA), pulse, Ethernet and Modbus to communicate information or data.
For physical components to be effective, hardware connects the components and acquires the information being collected at each of the physical locations. Typical hardware would include an Ethernet switch and discrete or analog I/O taking the signals to the plant automation system.
To convert collected data into something useful, it must be logged, organized and converted into functional information using a management software package. Examples of utility management software include Rockwell’s RS software, Siemens’ Access product line and Square D’s Powerlogic equipment.
Implementation Steps
Advertisement
Advertisement
A facility manager can break down implementation of a utility management system into a three-step process.
First, perform a site assessment to identify what metering capabilities currently exist and determine the complexity of the power distribution system. The site assessment should reveal what communication interfaces already exist and measure the physical distances for interconnection of equipment.
Next, work with the site assessment team to establish guidelines for use in any other facilities beyond the one where the initial assessment was completed. Through this process, document standards for the other facilities to follow, based on what was learned through the first site assessment, to provide consistency across the organization. The guidelines should include applicable automation vendors and products as well as metering or monitoring system vendors and products. Also include communication protocol for interconnecting the meters and devices within each facility, as well as any network infrastructure required to interconnect multiple facilities.
Finally, carefully review the report provided by consultants assisting with the assessment. A complete report should include both a summary of the site assessment findings and a recommendation for a utility management system based on the results, as well as the guidelines established in the process. In addition, the consultant should provide a budget estimate and implementation plan for installing a management system in the facility that was used for the initial assessment, along with guidelines and criteria for how the organization will leverage this plan across all facilities.
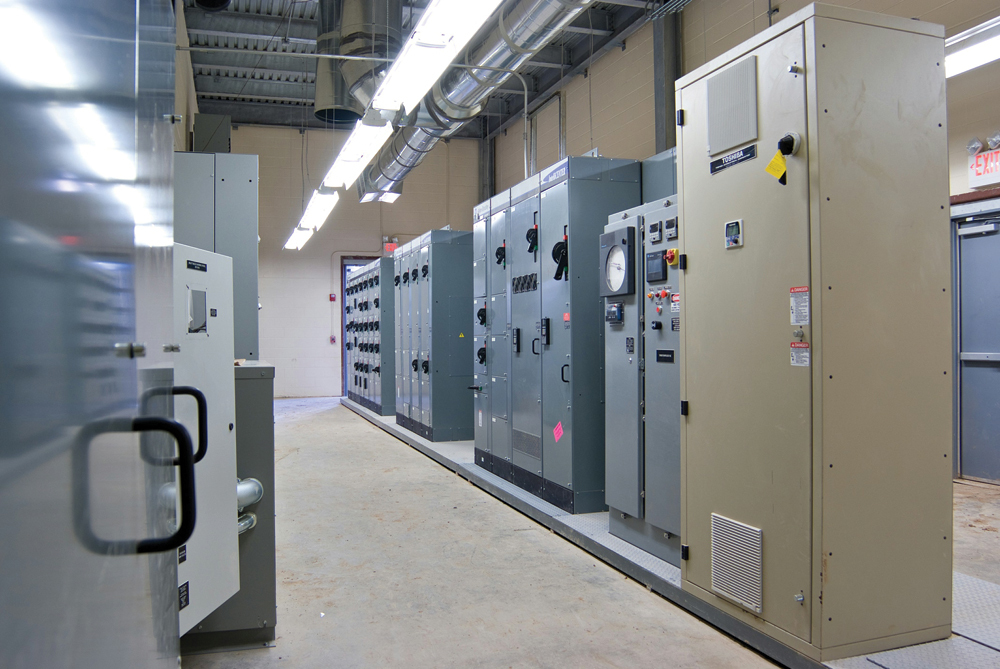
One 130 MMgy ethanol plant constructed in 2008, for example, applied a power monitoring system to separately meter electrical usage for plant process areas such as grain handling, mash, cook and prep, distillation, drying and water treatment. To accomplish this, motor control centers (MCC) were separated by process and named accordingly. The switchgears feeding the MCCs were designed with electronic trip units in the circuit breakers that also meter power usage in each MCC. Each switchgear has an overall circuit monitor to collect data from each circuit breaker trip unit, sending it via Ethernet to the plant automation system to be logged and eventually tracked and trended using energy management software. The automation system also collects inputs from other utilities such as water and natural gas for data analysis. With this configuration, the plant is able to track and monitor each area of the facility to optimize efficiency and assign accountability for energy costs to each area manager within the facility.
Given today’s market pressures, processing facilities must find every way to control input costs to protect profit margins. A utility management system provides the measurements needed to make sound management decisions.
Author: Jaron Vande Hoef
Senior Project Engineer, Interstates Engineering
(712) 722-1662
jaron.vandehoef@interstates.com
Upcoming Events


