2015 ethanol profits average 7 cents per gallon in model plant
Scott Irwin, University of Illinois, FarmDocDaily
January 7, 2016
BY Susanne Retka Schill
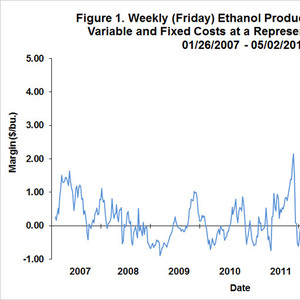
Net profits in the first half of 2015 held up surprisingly well, writes University of Illinois economist Scott Irwin, and, at 10 cents per gallon, were more than twice the average net profit of 4 cents per gallon from 2007-’12. The last half was more disappointing, with those net profits averaging 3 cents per gallon, with the last four weeks dipping into the negative. Average net profits for the year at the model plant were 7 cents per gallon. The analysis led Irwin to conclude that the record run of ethanol profits in 2013-’14 “were a temporary blip due to a unique set of circumstances rather than a new normal driven by surging ethanol exports.”
Irwin’s analysis, “The Profitability of Ethanol Production in 2015,” utilized a model of a representative Iowa ethanol plant that uses weekly ethanol and DDGS prices at Iowa ethanol plants. Irwin provided other key assumptions made in the model 100 MMgy plant, including debt financing, fixed and variable costs.
Advertisement
Advertisement
Irwin noted the primary price trends: “Ethanol prices started at about $1.30 per gallon at the beginning of 2015, rose to a peak of $1.60 in late May, and then dropped back to $1.30 by the end of the year. DDGS prices were strong in the first half of 2015, peaking near $180 per ton, but then declined precipitously to a low of $104 in October. Total revenue peaked at $2.12 per gallon in mid-May and reached a low for the year of $1.66 in late December.”
On the four major cost components, he noted that corn prices were relatively stable in 2015. “Total [corn] costs fluctuated in a relatively narrow band of about $1.70 to $1.90 per gallon. It is notable that natural gas costs continued to decline in 2015, setting a new low for the 2007-2015 sample period of 7 cents per gallon in mid-December.
Advertisement
Advertisement
Irwin also took a look at the percent return to equity holders, which averaged 9.8 percent over 2007-’15. “The standard deviation, a measure of risk, was 15.3 percent,” he writes. “By comparison, the average return for the stock market over this period, as measured by the S&P 500, was 8.3 percent and the associated standard deviation was 19.7 percent. The ratio of average return to standard deviation provides one measuring stick of an investment's return-risk attractiveness, and on this measure the ratio for ethanol investment, 0.64, compares favorably with the ratio for the stock market as a whole, 0.42.”
To view the analysis, and the charts drawn from the Iowa plant model, click here.
Related Stories

Neste Corp. on July 24 released second quarter results, reporting record quarterly renewable product sales volumes despite weaker margins. SAF sales were up nearly 80% when compared to the first quarter of 2025.

Valero Energy Corp. on July 24 released second quarter results, reporting a profitable three-month period for its ethanol segment. The renewable diesel segment posted a loss, but the company’s new sustainable aviation fuel (SAF) unit operated well.

The IRS on July 21 published a notice announcing the 2025 calendar-year inflation adjustment factor for the Section 45Z clen fuel production credit. The resulting adjustment boosts maximum the value of the credit by approximately 6%.

U.S. Secretary of Agriculture Brooke L. Rollins today announced the reorganization of the USDA, refocusing its core operations to better align with its founding mission of supporting American farming, ranching, and forestry.
The U.S. Department of Energy’s Office of Energy Efficiency and Renewable Energy is soliciting public comments on a preliminary plan for determining provisional emissions rates (PER) for the purposes of the 45Z clean fuel production credit.
Upcoming Events


