Benchmarking the Ethanol Lab

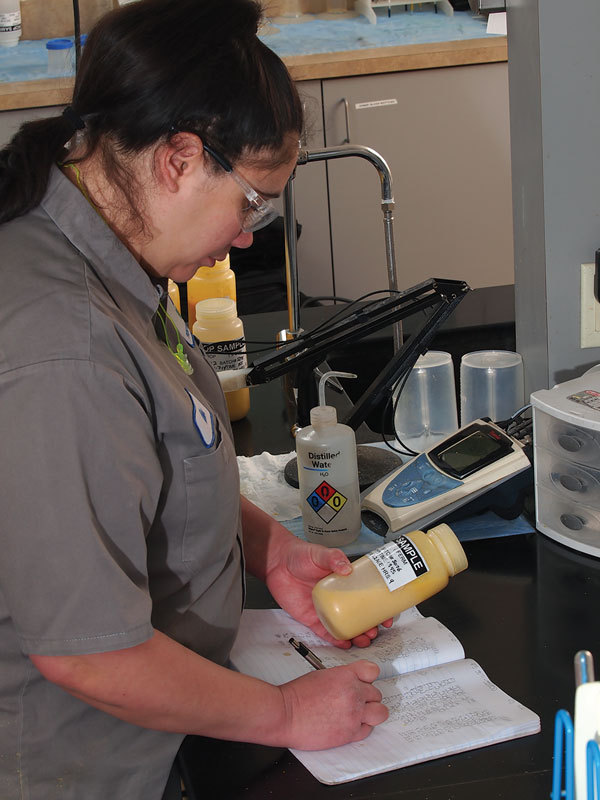
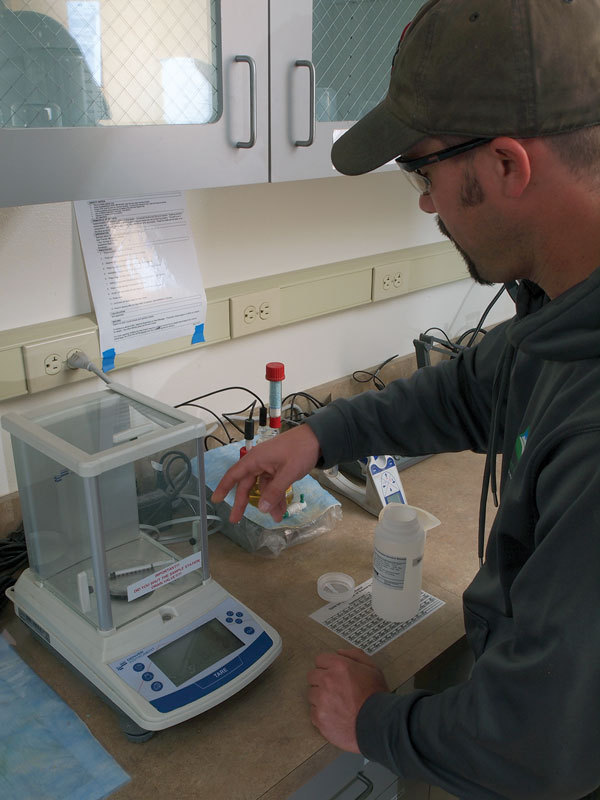
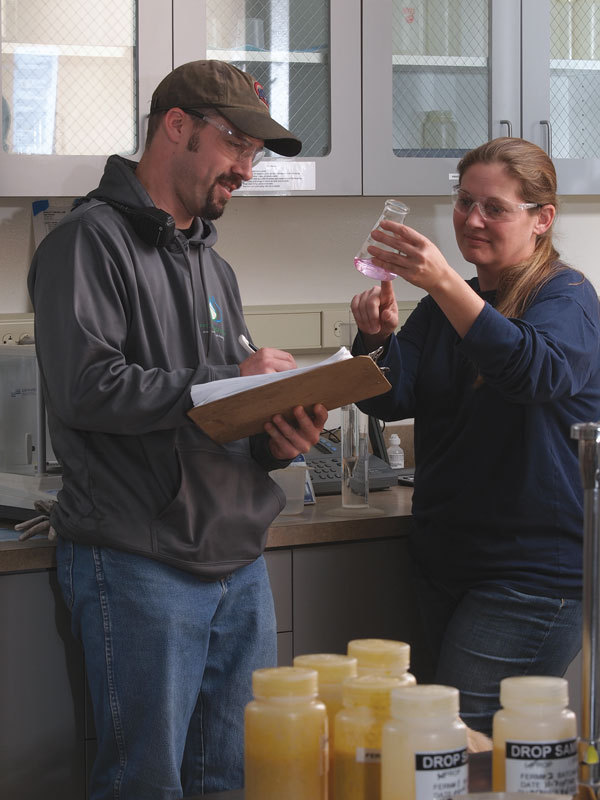
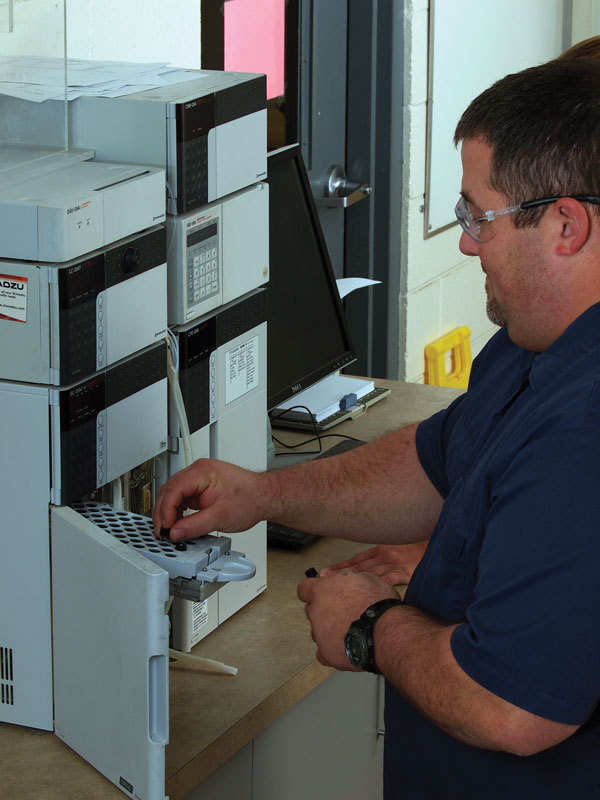
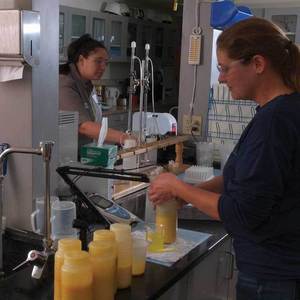
PHOTO: ROBERT MORRISSEY
December 17, 2014
BY Susanne Retka Schill
Quality assurance/quality control (QA/QC) standards for the front and back end of an ethanol plant are clearly set out by long-established federal grain inspection standards, ASTM standards and customer contracts. The process in the middle is a different story, however.
Not only are there no agencies or contracts prescribing testing procedures and equipment, but the process is inherently variable. On the surface, corn is quite uniform, but starch content does vary somewhat from field to field, and definitely from region to region and from year to year. Those variations, though often slight, affect enzyme dosing. The fermentation process itself is accomplished by a living organism, and the goal is to keep yeast happily producing ethanol under optimal conditions. But, the same environment that keeps yeast productive is also ideal for bacterial growth, detected through monitoring acetic and lactic acid levels. To keep the process humming along efficiently, it is absolutely essential that potential problems be caught early.
Thus, every ethanol plant has a system in place to pull samples every few hours for testing, searching for key indicators that the process is moving along as expected. Many tests are done in-house by the ethanol labs and others by third-party labs, often on composite samples sent on a weekly basis. Plant operators and lab technicians work under the supervision of a lab manager tasked with making sure the equipment, test methods and general procedures are up to the task. At the heart of fermentation monitoring is a complex piece of equipment that costs $50,000-plus—the high performance liquid chromatograph (HPLC). It can separate, identify and quantify multiple compounds in a sample in about 20 or 30 minutes. The ethanol lab uses it to monitor carbohydrates, ethanol concentration, glycerol, lactic and acetic acids, and more.
The HPLC may be the workhorse, but it is far from being the only sophisticated piece of equipment in the lab. Gas chromatographs are used for analyzing finished ethanol, pH meters and moisture analyzers are used to monitor several points of the process, hydrometers measure proof. Microscopes are used to monitor yeast health. To get accurate results, each of the instruments needs to be in working order, calibrated and used properly. Lab managers routinely use check samples, statistical analyses and benchmarking to evaluate just how good their lab procedures are.
“Being able to measure the quality of your methods and benchmarking against another method or against a known standard puts you in a position to know when the numbers start changing, if it’s an analytical issue or if it could be a process issue,” explains Amanda Huber, process manager at Front Range Energy LLC, a 50 MMgy plant in Windsor, Colorado. “If you have no way of knowing it’s an analytical issue, you have no choice but to attribute it to process and you start making changes to the process. Sometimes that’s not going to improve things.”
Huber uses several methods to check the accuracy of the equipment and testing methods in the lab she manages. The moisture analyzer used to measure the solids in mash or moisture levels in distillers grains can be difficult to get standardized, she explains. “We do a weekly comparison with the oven method in triplicate, keeping an eye on how the instrument and methods are performing. If it’s been within 3 to 5 percent agreement with the oven method for months and months, and suddenly it’s 8 percent, we’ll investigate.”
Going Standard
Close attention is given to calibrating the HPLC. Huber explains that when she began managing the lab at the plant startup, nearly nine years ago, they used a single standard for calibration, as recommended. After several months, she found that it wasn’t doing an accurate job of predicting alcohol production and yield. “At that point, we added a second calibration standard just for the ethanol peak, and definitely saw better correlation of our production with our analytical,” she says. She now uses a custom-made standard along with a common standard and three data points for the HPLC. Because the HPLC is used to monitor fermentation and measure the success of fermentation at the finishing point, it is helpful to calibrate at more than one concentration of each analyte, she explains. “We’ll measure anywhere from zero to 15 percent by weight ethanol and I think a lot of people are only doing a calibration at 12 percent. So you don’t know your instrument response to concentrations other than that.”
Sabrina Trupia, research director at the National Corn-to-Ethanol Research Center, explains the core of the center’s work is monitoring fermentations, relying upon HPLC data. “With HPLC, running several standards is a great idea, once a day, just to check on the stability of the instrument,” she says. NCERC’s lab uses five standards each with different compositions of the eight components being tested for in the process, and runs a check sample every 10 or 20 samples. If the numbers from one production sample are abnormal, before any changes to the process are made, she suggests first checking the HPLC by running a check sample, rerunning the questionable production sample, and then running another check sample. If all three numbers are outside the norm, it’s an indicator the machine is off. If results from the two check samples return true numbers, then it’s time to pull a second production sample to verify something is truly wrong with the process and begin investigating causes.
In addition to ongoing education through seminars such as the annual Fuel Ethanol Laboratory Conference, ethanol lab managers turn to instrument manufacturers and vendors for help in keeping their lab running at top performance. Some single-ownership plants work together in buying clubs and build on that working relationship to form a peer group of lab managers who periodically meet to share tips. Plant QA/QC teams can also participate in round robins organized by NCERC or enzyme or yeast vendors. The round robin organizer prepares samples that are sent to each participating plant. Each lab runs the specified tests and sends the results to the organizer who compiles them all and reports back with comparison information.
Turning to Statistics
Another method for monitoring lab performance is through statistical analysis. QA manager Erin Robertson at GreenField Ethanol-Johnstown in Ontario explains GreenField’s QA departments use measurement systems analysis for their instruments. “We use historical data, so we know how that machine should be performing from day to day. We use statistical process control charts. If you’re falling above or below a certain line or limit, it lets you know something has changed within your system.” Periodically, the QA/QC team organizes a gage repeatability and reproducibility (R&R) exercise. Everybody who uses the instrument participates, roughly 25 people at the plant, including operators and lab personnel. Each person runs the same sample multiple times (demonstrating repeatability) and the results from all participants are compared (showing reproducibility). “It lets you know how much of the variation is coming from the different operators using it,” Robertson explains, “and how much from the actual measurement itself and the interaction between those.”
Darrell Veres, plant manager at the 65 MMgy Canadian plant, says this can help identify when additional training is needed. “If the variation is too wide, then you go back and retrain the operators to get that variation as tight as you possible can,” he says. Veres serves as the mentor for the QA peer group, which includes Robertson and the QA managers from GreenField’s three other plants in Ontario and Quebec.
“When it comes to validating test methods and benchmarking, how we’re doing, it’s invaluable to have somebody in the same position at another plant where you can bounce ideas back and forth,” Robertson adds. “We can do interlab cross checks and round robins, where we’re testing the same sample and making sure we’re getting the same answer. We can tweak our methods based on that.”
Time to Standardize the Middle?
With the goal of QA/QC programs being to tighten up the variation—both in the process and in the lab results—Trupia raises the question of whether it’s time for the ethanol industry to adopt a common set of good practices for the lab. “What I see now is a lot of variability between different ethanol plants,” she explains. The Renewable Fuels Association publishes a guide for quality assurance and quality control, but while it establishes basic principles that could be applied to process testing, the QA/QC guidelines focus on end products—ethanol, distillers grains, corn oil and carbon dioxide. “I understand the concern on producing quality coproducts and ASTM compliant ethanol,” she says, adding that best practices for QA in the middle process are equally important.
Guidelines for the process would help establish best practices for sampling frequency, type of sampling, recommended replications, how often to run check samples, how to determine whether the staff is properly performing manual tasks such as pipetting or titrating, and more.
She also thinks the industry would benefit from more benchmarking activities so ethanol labs can compare reporting results on their process testing. “ASTM does this for ethanol,” she points out. “They send you a monthly sample and you test for all the requirements—ethanol, methanol, water, specific gravity, and so on. They send you your answer and where you stood,” she explains. “It’s very helpful. If your methanol is systematically high over several tests and you’re using the method that ASTM is prescribing, then there’s something wrong with your instrument, or your calibration. There’s something that is not working. You can trace it back, if you have good records on your lab upkeep.”
Author: Susanne Retka Schill
Senior Editor, Ethanol Producer Magazine
701-738-4922
sretkaschill@bbiinternational.com
Advertisement
Advertisement
Related Stories

U.S. fuel ethanol capacity fell slightly in April, while biodiesel and renewable diesel capacity held steady, according to data released by the U.S. EIA on June 30. Feedstock consumption was down when compared to the previous month.
XCF Global Inc. on July 8 provided a production update on its flagship New Rise Reno facility, underscoring that the plant has successfully produced SAF, renewable diesel, and renewable naphtha during its initial ramp-up.
FutureFuel Corp. on June 17 announced it will temporarily idle its biodiesel facility upon completion of its remaining contractual obligations, anticipated to occur by the end of June. The company is shifting its focus to specialty chemicals.

The U.S. EPA on June 18 announced 1.75 billion RINs were generated under the RFS in May, down from 2.07 billion that were generated during the same period of last year. Total RIN generation for the first five months of 2025 reached 9.06 billion.

TotalEnergies has announced the company expects its facilities will be able to produce more than half a million tons of SAF a year by 2028 to cover the increase in the European SAF blending mandate, set at 6% for 2030.
Upcoming Events


