Carbon Counting on the Farm

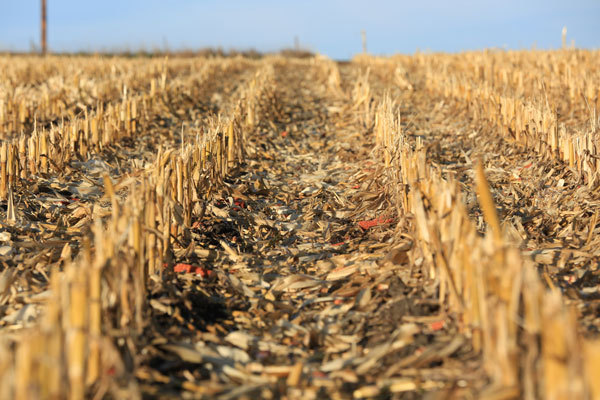
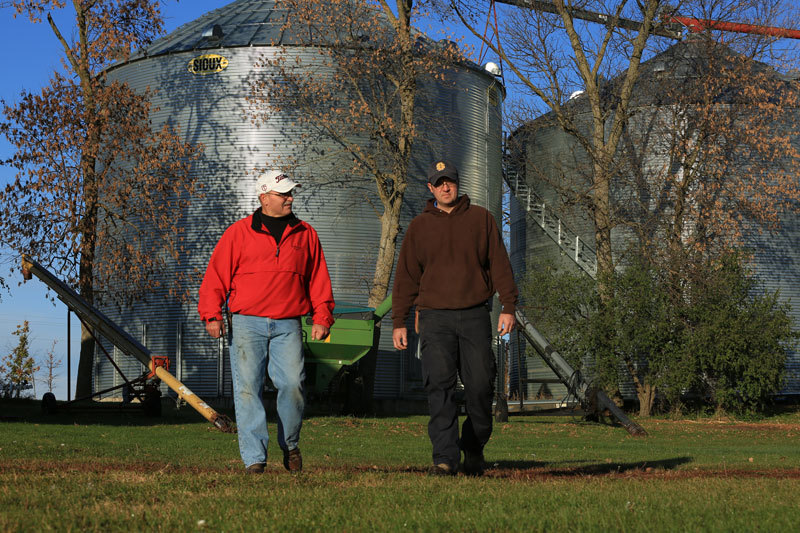
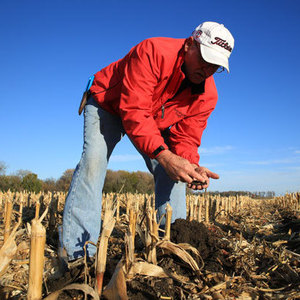
PHOTO: CARBON HARMONY/RICH MURPHY
October 8, 2021
BY Susanne Retka Schill
For the past decade, Ron Alverson has been on a mission to get corn properly accounted for in the lifecycle analyses (LCA) of ethanol made from it. Corn has been vastly undervalued for its ability to sequester carbon, he says.
Alverson figures the corn fields on the farm he and his son Keith operate in southeastern South Dakota sequesters carbon to the tune of 45 grams of CO2 per megajoule every year, on average—calculated as the carbon intensity when applied to an ethanol LCA. That amounts to roughly 1.5 tons of carbon per acre.
When Alverson converted the farm over to ridge tillage in 1983, he did extensive soil testing to establish a baseline to measure the effect of the new practice, following the advice of his college professor in soil science. Soil organic matter levels grew from 3.2%, on average, at the start to about 5% now, just under the 6% tested in an adjacent unbroken pasture. In 2015, the Alversons decided to hire a third party to analyze their data and conduct more soil testing. Alverson wanted the independent data to back up his contention that corn is undervalued as an ethanol feedstock.
Alverson got interested in the life cycle analyses of corn when the Dakota Ethanol board he served on considered the requirements of the Renewable Fuel Standard and the California Low Carbon Fuel Standard—he was one of the organizers of the ethanol plant at Wentworth, South Dakota, not far from his farm near Chester.
“I started looking at the models and asking, ‘How do you determine that? What are the factors that make it low carbon?’” Alverson says. “I started reading up and cracked open the GREET model. It was super intimidating for a long time, but I kept at it persistently, talking to the guys at Argonne Lab and asking a lot of questions.”
Among the things he learned was that the GREET (Greenhouse Gases, Regulated Emissions and Energy Use in Transportation) model developed by the DOE’s Argonne National Laboratory assumes the worst-case scenario for nitrogen loss, resulting in a stiff penalty for nitrous oxide emissions. “They make the assumption that we’re losing 40% of nitrogen we apply to fields to volatilization and leeching. That’s just crazy. There’s not any modern research that’s been done that would suggest we’re losing that much nitrogen,” he says. Nitrous oxide emissions from the projected nitrogen losses make up a big portion of corn’s carbon intensity, as the greenhouse gas impact is nearly 300 times more powerful than an equal amount of carbon dioxide.
Alverson questioned multiple other factors and began working on getting the modeling improved, working with the American Coalition for Ethanol (ACE) where he’s a board member and past president. Among the things he takes issue with is that the modeling doesn’t account for the differing soil carbon impact of feedstocks. “They treat soybeans the same as corn, sorghum or sugar cane,” he says. “If you said that in a room of soil scientists and crop scientists, they’d laugh. There’s a dramatic difference and corn is head and shoulders above every other crop.”
In 2012, Alverson worked with Dakota Ethanol to put together a pathway application to the California Air Resources Board, enlisting the aid of experts such as South Dakota State University soil scientist David Clay and University of Illinois-Chicago’s Steffen Mueller. They made an application for a 15 gram reduction in their pathway with CARB based on the soil test results in the plant’s corn draw showing consistent better-than-average soil organic matter levels. CARB gave them a fair hearing, Alverson recalls, but in the end, it was rejected.
Advertisement
Uncertainty over the reliability of measuring soil sequestration from year to year is part of the problem, Alverson admits, although accurately documenting average soil carbon sequestration over a span of several years is possible. He’s investigated how soil carbon is modeled using factors such as beginning soil organic matter, soil type, rainfall, crop types, yield. “Put those in and it will kick out a number and that’s exactly how they come up with penalty for land use change with soil carbon loss,” he says. “For them to penalize us for land use change using soil carbon models and not doing the same for when soil carbon is going the other way in these models is a double standard.”
Tools for Ag GHG Accounting
The USDA has been working to reliably quantify the benefits of climate smart farming practices, says Bill Hohenstein, USDA director of the Office of Environment and Energy Policy. “We’re doing a lot of work on farm scale greenhouse gas accounting, so we can document if you shift practices, how much you can improve your greenhouse gas profile.” For nearly two decades, the National Resources Conservation Service has been fine-tuning COMET-planner on its website, a tool for farmers to evaluate GHG benefits from conservation practices. More recently in the GRACEnet program, a network of scientists at USDA’s Agricultural Research Service have been developing standard ways of evaluating and reporting both carbon sequestration from farming practices and reduced emissions from efficient fertilizer management.
“We’re working with the folks at GREET right now to incorporate these climate smart farming practices into GREET,” Hohenstein says. Specific practices include tillage, cover crops, buffers and nutrient management practices.
There is intense interest in finding ways to incentivize farmers to improve farming practices, he says. Last spring’s request for public input on USDA’s Climate Smart Agriculture and Forestry initiative generated over 2,000 responses, 500 coming from groups and association. “We heard a lot about various strategies for conservation programs, but also strategies to partner with industry,” Hohenstein says. The agency is working through the suggestions and considering how it might work with industry and the private sector. One of the questions he sees needing attention is how to handle farm level data to quantify GHG reductions for the emerging carbon markets. “Do you use averages, or do you try to do soil testing on each farm and use the real data?” he says. “The challenge with using real data is it’s expensive to do that kind of testing, and there are expenses with compiling and reporting the data.”
In late September, the USDA awarded $7.5 million to a conservation program led by ACE that will help secure farmers access to low carbon fuel markets through the adoption of climate smart agricultural practices. Notably, Dakota Ethanol and its corn suppliers are involved (see news on page 14).
Verification Models
California’s Air Resources Board has begun allowing some biofuel producers to demonstrate their feedstock supplies to achieve better-than-average carbon intensity, says Kari Buttenhoff, director of the compliance program and a partner at Christianson PLLP. The way the program is structured offers some clues as to how systems that reward farmers for CI reductions might evolve.
Feedstock suppliers could be classified two ways, one as intermediate facilities delivering to multiple biofuel producers, passing along all their information to each biofuel producer and becoming part of each producer audit. Another option is to become a joint applicant, where the feedstock supplier submits data directly to CARB and is responsible for reporting and securing audits. In that case, the only information passed along to the biofuel producer is the CI score itself.
On the first round under the revised rules due August 31, Christianson audited renderers supplying feedstocks to biodiesel plants. “We’re just starting to see some of the hurdles,” Buttenhoff says. “If a joint applicant doesn’t meet a verification deadline or has issues, what does that mean to the biofuel producer they’re attached to? We’ve had some of this happen where the producer is saying it’s not their fault, it’s the renderer’s fault.”
Advertisement
Fewer issues have emerged for intermediate facilities, which is the more likely model for corn producers, she adds, “but the way the California rules are written would have to be tweaked for farming. If a biodiesel plant has three renderers signed up with them, we have to visit each of the three renderers as well as the biodiesel producer.” With the biofuel producer responsible for coordinating the audits and the cost, it could become cumbersome with hundreds of corn suppliers.
While California’s LCFS offers a glimpse at how farm-level carbon accounting might unfold, there are other models, Buttenhoff continues. The International Sustainability and Carbon Certification program allows an aggregate approach. A third-party aggregator collects the data and is responsible for reporting, with only a portion of the individuals audited each year alongside the aggregator. “So over a three or five year period everyone gets audited, but not everyone gets audited every year,” she says. While that would lighten the audit load on farmers, the scores would likely be averaged and “they might not get the CI score and premium they would get if they went in as an individual.”
Gradable Aggregation
Poet is partnering with Farmers Business Network to develop an aggregate approach, starting with a pilot project three years ago at the 110 MMgy Chancellor, South Dakota, facility. The goal for FBN was to tap into digital technologies to verify a CI score without boots on the ground, says Steele Lorenz, FBN head of sustainable business, using everything from receipts to precision agriculture data collected by equipment. Weather and satellite data are used to confirm a yield claim and artificial intelligence is used to spot errors and potential fraud. The collected data gets plugged into GREET to generate a CI score.
Following the successful pilot, Poet and FBN launched the new program, dubbed Gradable, last year with all the farmers participating in the pilot signing on, with the exception of one who retired.
The CI scores for the farms in the program average 20% lower than the national average, reports Doug Berven, Poet vice president corporate affairs, and spans 7.5 million bushels from 126,000 acres. With all of the Chancellor ethanol going into the California LCFS market, Poet was able to pay farmers premiums ranging from $35 to about $50 an acre, he adds.
Lorenz is enthused about the progress being made on several fronts to make ag carbon accounting pay. In October, he presented FBN’s work with variable feedstock scoring to CARB at a public workshop discussing potential LCFS revisions. “We were very well received,” he says. The next set of LCFS rules aren’t due to come out until 2023, but he’s optimistic field level practices will be incentivized.
In addition to California, Lorenz reports developers of Canada’s national clean fuels policy appear to be open to including feedstock scoring. He’s also encouraged by the discussions of a Midwest Clean Fuels Policy in several states that seek to include incentives for farm-level CI reductions. In addition to low carbon fuel markets, voluntary markets are emerging in the feed sector for corn, soybeans and coproducts, Lorenz reports. “There is going to be increased demand to provide quality attributes around the environmental impact of animal protein products.” That, in turn, may broaden the focus of CI reduction efforts from just western-facing producers to eastern Corn Belt suppliers to poultry and swine feed markets.
As Poet sets out to achieve net-zero emissions by 2050 (see news on page 14), Berven expects the company to expand the Gradable program to more facilities, as soon as approvals are in place. Farmers want to improve and promote good soil, crops and the environment, though it often costs more to employ climate smart practices, he says. “This program incentivizes them to make those investments and get a return they might not have had in the past.” He points out that 40,000-some farmers deliver grain to plants in the Poet family. “If we could employ this throughout our entire footprint, just imagine what we could do with the CI score of farming overall.”
Author: Susanne Retka Schill
Contact: editor@bbiinternational.com
Related Stories
Keolis Commuter Services, the Massachusetts Bay Transportation Authority’s operations and maintenance partner for the Commuter Rail, has launched an alternative fuel pilot utilizing renewable diesel for some locomotives.
Virgin Australia and Boeing on May 22 released a report by Pollination on the challenges and opportunities of an International Book and Claim system for sustainable aviation fuel (SAF) accounting.
The biodiesel industry has been facing turbulence, but the release of long-overdue policy could course-correct.
The U.S. House of Representatives early on May 22 narrowly passed a reconciliation bill that includes provisions updating and extending the 45Z clean fuel production tax credit. The bill, H.R. 1, will now be considered by the U.S. Senate.
U.S. EPA Administrator Lee Zeldin on May 21 stressed the agency is working “as fast as humanly possible” to finalize a rulemaking setting 2026 RFS RVOs during a hearing held by the U.S. Senate Committee on Environment and Public Works.
Upcoming Events


