Commodities: USDA report contains some surprises
January 20, 2015
BY Jason Sagebiel, FCStone
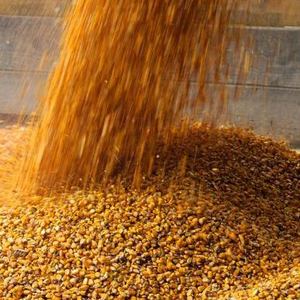
The USDA released the final January supply/demand estimates for the 2014/15 corn crop and a surprising fact was that the national corn yield was lowered from 173.4 to 171. This was the largest yield drop from November to final since 1993, when the yield was dropped by the same 2.4 bushels. Harvested acres remained unchanged; however, planted acres declined by 300,000 acres. The result was corn production at 14.216 billion bushels, down 191 million bushels. Demand for corn in this crop year was 13.595 billion bushels, down 75 million by from the previous estimate but 141 million bushels higher than 2013/’14. Demand for corn for ethanol increased by 25 million bushels to 5.175 billion bushels; however, due to higher prices for milo there was a reduction of milo use in the industrial sector. Corn for feed and residual demand decreased by 100 million bushels despite livestock numbers increasing. Export demand was unchanged from the previous estimate and lower by 167 million bushels from a year ago. This is due to larger world corn stocks and a strengthening U.S. dollar. Overall corn carryout was lowered to 1.877 billion bushels. One thing to note is in Jan 2014 corn carryout was pegged at 1.631 billion bushels and declined to a final carryout of 1.232 billion bushels. The rise of exports throughout the year was the major reason for observing a shrinking carryout.
World corn ending stocks declined to 189 million metric tons (mmt) in this report, yet this is still an increase of 16.92 mmt and 51.21 mmt greater than in 2013/’14 and 2102/’13 respectively. South America’s Brazil and Argentina are poised to produce 75 mmt and 22 mmt respectively. Ukraine is expected to produce 27 mmt. With no great weather concerns this growing season in the Southern Hemispere the global marketplace will be ready to buy South American corn when it enters the supply chain. Ukraine and eastern Europe will have corn for export but political woes could be seen as hampering their ability to fulfill that void. However, with no political fallout that corn has easy acess to the eastern world economies. Now that U.S .corn (and subsequently distillers grains) have been approved to enter the China supply chain, this could be longer term positive for the U.S. corn producer.
Advertisement
Advertisement
Corn price action is limited to the down side by the firm cash markets, however, upside limitations will be met by corn consumptive end-user observing dwindling processing and, or production margins.
| Date | High | Low | Close |
| January 16, 2015 | 3.88 | 3.79 1/2 | 3.87 |
| December 16, 2014 | 4.11 | 4.04 | 4.06 |
| January 16, 2014 | 4.30 | 4.25 | 4.28 |
Advertisement
Advertisement
Related Stories

The USDA significantly increased its estimate for 2025-’26 soybean oil use in biofuel production in its latest World Agricultural Supply and Demand Estimates report, released July 11. The outlook for soybean production was revised down.

U.S. fuel ethanol capacity fell slightly in April, while biodiesel and renewable diesel capacity held steady, according to data released by the U.S. EIA on June 30. Feedstock consumption was down when compared to the previous month.

The U.S. EPA on July 8 hosted virtual public hearing to gather input on the agency’s recently released proposed rule to set 2026 and 2027 RFS RVOs. Members of the biofuel industry were among those to offer testimony during the event.

The U.S. exported 31,160.5 metric tons of biodiesel and biodiesel blends of B30 and greater in May, according to data released by the USDA Foreign Agricultural Service on July 3. Biodiesel imports were 2,226.2 metric tons for the month.

The USDA’s Risk Management Agency is implementing multiple changes to the Camelina pilot insurance program for the 2026 and succeeding crop years. The changes will expand coverage options and provide greater flexibility for producers.
Upcoming Events


