Demand for corn will be key, supported by low prices
November 11, 2014
BY Jason Sagebiel, FCStone
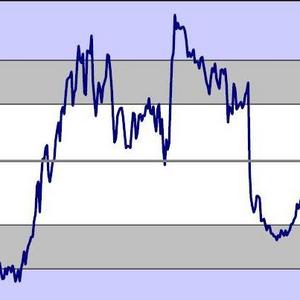
As the old saying goes “the cure for low prices is low prices.” Demand and corn at five-year lows developed a low pricing point as of late October, despite a record yield and big carryout. Traders admit that a big crop looms on the horizon; however, when corn was sitting at the $3.20 price level and all corn consumptive users had profitable margins, demand was anxiously awaiting harvest. Unsuitable weather and a later maturing crop delayed harvest and left end-users anxious. In addition, low prices attracted new buying into the market place.
So where is the big crop? The USDA is projecting just over a 2.0 billion bushel carryout or 15.2 percent carryout to use ratio. Production is estimated at 14.475 billion bushels with a 174.2 bushel per acre yield. Carryin from 2013/14 is 1.236 billion bushels. Overall supply this year is 15.736 billion bushels, with demand estimated currently at 13.655 billion bushels. Feed demand is expected to use 5.375 billion bushels, up 50 million bushels from the previous report and 250 million bushels from a year ago. Ethanol demand is expected to consume 5.125 billion bushels, down 5 million bushels from last year’s 5.13 billion bushels. The U.S. is expected to export 1.750 billion compared to 1.917 billion last year. A stronger U.S. dollar and larger world carryout will reduce global dependency on U.S. corn. The USDA projects an average farm price of $3.10 to $3.20 versus $4.46 last year. Global corn carryout increased to 190.58 million metric tons, up from 173 million metric tons a year ago and 137.66 million metric tons in 2012/13.
So what keeps corn supportive? Demand will be the key and lower prices will support that cause. Cash movement into the market. More storage availability and carryin the corn market will help producers and commercial entities hold onto bushels longer. Weather woes in South America, including whether there is a good or bad crop weather in Argentina and Brazil, could be very influential on U.S. grain and/or oilseed prices this winter.
|
Dec. Futures |
|||
|
Date |
High |
Advertisement
Low
Close
October 27, 2014
3.63 3/4
3.48 1/2
3.63
September 26, 2014
Advertisement
3.27
3.22 3/4
3.23
October 28, 2013
4.40
4.30 1/4
4.30 3/4
Related Stories

The USDA significantly increased its estimate for 2025-’26 soybean oil use in biofuel production in its latest World Agricultural Supply and Demand Estimates report, released July 11. The outlook for soybean production was revised down.

U.S. fuel ethanol capacity fell slightly in April, while biodiesel and renewable diesel capacity held steady, according to data released by the U.S. EIA on June 30. Feedstock consumption was down when compared to the previous month.

The U.S. EPA on July 8 hosted virtual public hearing to gather input on the agency’s recently released proposed rule to set 2026 and 2027 RFS RVOs. Members of the biofuel industry were among those to offer testimony during the event.

The U.S. exported 31,160.5 metric tons of biodiesel and biodiesel blends of B30 and greater in May, according to data released by the USDA Foreign Agricultural Service on July 3. Biodiesel imports were 2,226.2 metric tons for the month.

The USDA’s Risk Management Agency is implementing multiple changes to the Camelina pilot insurance program for the 2026 and succeeding crop years. The changes will expand coverage options and provide greater flexibility for producers.
Upcoming Events


