Reverse Osmosis System Operation and Monitoring

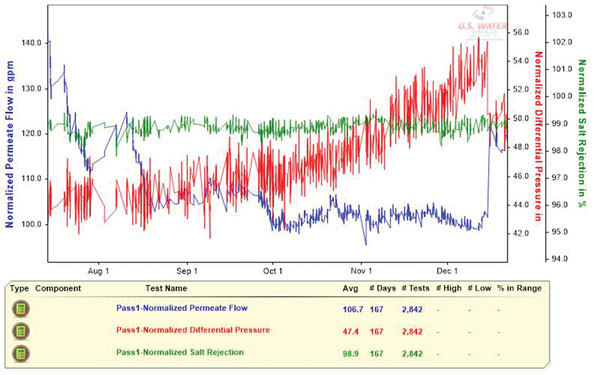
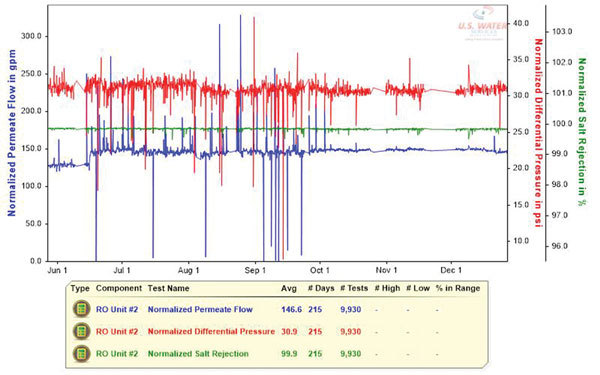
PHOTO: U.S. Water Services
January 19, 2017
BY Wes Byrne
The way a reverse osmosis (RO) system is operated and monitored can affect its performance and membrane longevity. Operating with too high a flow rate can cause scale formation or an increased rate of membrane fouling. The extent of these problems will be apparent in three RO performance variables, which can be used as a basis for when membrane cleaning should be performed. Cleaning before fouling becomes too severe will make it easier to fully restore original RO performance without the use of aggressive cleaning chemicals and, in so doing, maintain the membrane life.
In a well-designed RO system, small particles will move along the membrane surface through the RO array until exiting in the concentrate stream. But, if there is a particularly high concentration of particles or if the RO is operated too aggressively, particles can become overly concentrated next to the membrane surface because of high water permeation or low flow across the membrane surface. The particles may then coagulate into larger particles that are more likely to stick to the membrane surface or get caught in the membrane spacing material. This will result in an increase in the pressure required to obtain the same permeate flow rate.
RO systems are usually operated by adjusting the membrane feed pressure as needed to achieve the desired RO permeate flow rate. This may be accomplished by using a variable frequency drive (VFD) to control the high-pressure pump motor’s rotational speed, or it may be achieved using a throttle valve located directly downstream of the pump. With VFD control, the adjustment for achieving a desired permeate flow rate may be automatic. The RO system will also have a concentrate stream throttle system to achieve the desired concentrate stream flow rate. This system may include an orifice plate or, more commonly, the concentrate flow rate would be adjusted with a valve, either manually or automatically controlled.
Along with the permeate and concentrate flow meters, pressure sensors are installed in the system piping to monitor the membrane pressure entering the membrane elements, the concentrate pressure exiting the membrane and possibly the pressures within the plumbing manifolds that connect the membrane vessel stages. A permeate pressure sensor may be needed, especially if there is significant or variable permeate back-pressure on the system.
The electrical conductance of the water streams is used to monitor how well the RO is removing dissolved salts from the raw water. A percent salt rejection for the system is calculated by subtracting the permeate conductivity from the feed stream conductivity and then dividing this value by the feed conductivity. (The original calculation for the RO salt rejection is based on total dissolved solids concentrations accurately established in laboratory measurement.) The salt rejection percentage is probably the most well-watched performance variable indicating how well the RO system is working, since salt removal is the primary reason for having the RO.
Additional monitoring instruments may be needed if there is variability in the feed water characteristics, such as if a chemical is being added. If the water acidity changes naturally or as a result of chemical addition, then the water pH should be continuously monitored as it can have a dramatic impact. If chlorine is being removed upstream of the RO, an online chlorine monitor or possibly an oxidation-reduction potential (ORP) monitor may be used to warn against the presence of chlorine in the RO feed stream.
Critical Monitoring Variables
Monitoring the percent salt rejection is important, but it is limited in its ability to communicate the state of the RO membrane and not a good gauge of membrane fouling or scale formation. With the exception of calcium carbonate scale, most types of fouling or scale will not impact salt rejection until the RO system performance is severely impacted and then it may be too late to restore performance by cleaning.
The relative ability for water to permeate the RO membrane can be tracked using a variable called the normalized permeate flow rate, which is the RO permeate flow rate standardized for the effects of operating pressures, dissolved salt content and water temperature. The feed-to-concentrate pressure drop tracks the resistance to the passage of water through the flow channels of the various membrane elements in the RO system array. It is the difference between the pressure entering the membrane vessels and the pressure exiting the vessels. This value may be calculated for the entire RO vessel array, or if interstage pressures are available, it can be calculated for the individual vessel stages. If flow rates are not kept constant when operating the RO, it will be necessary to standardize the pressure drop for the effect of the changing flow rates in calculating normalized pressure drop values. This then allows direct comparison of these values over time, regardless of whether any flow rates have changed.
Small suspended particles or salt particles that coat the RO membrane surface will cause the RO normalized permeate flow rate to decline. Larger particles that get caught within the membrane flow channels and subsequently block the flow through the membrane elements will cause the normalized pressure drop to increase, specifically in the stage where the blockage is occurring, as well as for the entire system. If something in the water is chemically reacting with the RO membrane, the effect of this will likely be apparent in the normalized permeate flow rate and possibly in the salt rejection. For example, if chlorine is allowed to come into contact with the RO membrane, the extent of membrane oxidation will be apparent as an increase in the normalized permeate flow rate soon followed with a decline in RO salt rejection.
A thorough understanding of the state of the RO system can thus be gained by routinely calculating and graphing the salt rejection and the normalized performance variables. But their values may be misleading if any of the instrument readings from which the variables are calculated are inaccurate. It is absolutely critical that monitoring instruments be routinely calibrated and repaired or replaced, if their readings are clearly in error.
Cleaning
Chemical cleaning is a routine requirement for most RO systems. The necessary cleaning frequency for maintaining original RO performance is related to how well the RO pretreatment equipment prevents scale formation and reduces the concentration of suspended solids entering the RO. The concentration of biological particles in the RO feed stream as well as activity directly within the RO must also be minimized.
As these fouling solids or scale particles are allowed to accumulate within an RO system over time, the solids will often change in their characteristics and become more resistant to cleaning. Clay and biological materials will compress against the membrane surface and become chemically resistant as water is squeezed out. Scale formations may change from being primarily calcium carbonate, which is relatively easy to clean, to calcium sulfate, which is much more difficult to remove. If fouling is allowed to proceed to the point that dissolved salts cannot easily diffuse back into the bulk stream going through the membrane elements, various salts may precipitate within the pocket of fouling solids directly next to the membrane surface.
The RO system should be chemically cleaned while the extent of fouling is minor as based on the normalized RO performance variables. Most of the RO membrane manufacturers recommend cleaning before these normalized variables change by 15 percent. By limiting the extent of fouling or scale formation before cleaning, it becomes much more likely that the fouling solids will be removed using standard cleaning procedures, which then restores the original system performance. This then improves the mobility of particles and dissolved salts, and so restores the original fouling rate.
In summary, operating an RO with the intended flow rates may reduce the potential for membrane fouling. The extent of fouling or scale formation is best monitored using normalized permeate flow and pressure drop, which then can be used to determine when to clean the RO while the fouling solids are most easily removed. This will make it possible to fully restore original RO performance and maintain membrane life.
Author: Wes Byrne
Consultant, Membrane Technologies, U.S. Water
info@uswaterservices.com
Advertisement
CONTRIBUTION: The claims and statements made in this article belong exclusively to the author(s) and do not necessarily reflect the views of Ethanol Producer Magazine or its advertisers. All questions pertaining to this article should be directed to the author(s).
Advertisement
Related Stories
FutureFuel Corp. on June 17 announced it will temporarily idle its biodiesel facility upon completion of its remaining contractual obligations, anticipated to occur by the end of June. The company is shifting its focus to specialty chemicals.

The U.S. EPA on June 18 announced 1.75 billion RINs were generated under the RFS in May, down from 2.07 billion that were generated during the same period of last year. Total RIN generation for the first five months of 2025 reached 9.06 billion.

TotalEnergies has announced the company expects its facilities will be able to produce more than half a million tons of SAF a year by 2028 to cover the increase in the European SAF blending mandate, set at 6% for 2030.

Total U.S. biofuels production, including ethanol, renewable diesel, biodiesel and other biofuels, including SAF, averaged a record 1.39 million barrels per day last year, according to data released by the U.S. EIA on June 9.

The U.S. EIA reduced its 2025 and 2026 production forecasts for a category of biofuels that includes SAF in its latest Short-Term Energy Outlook, released June 10. The forecast for 2025 renewable diesel production was also revised down.
Upcoming Events


