Six Sigma Provides Analytical Tool for Ethanol Producers
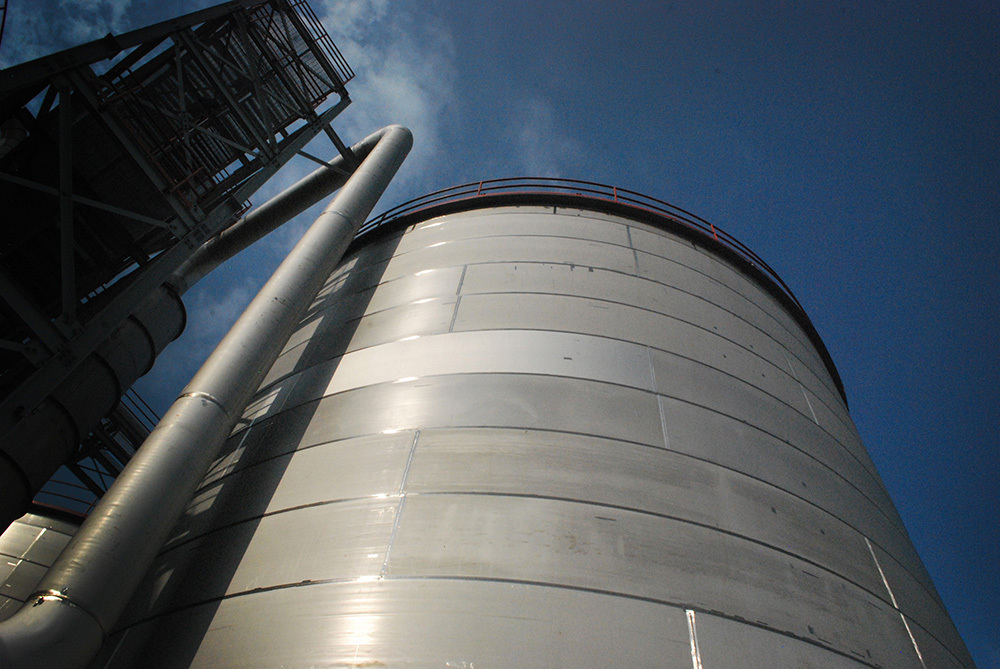
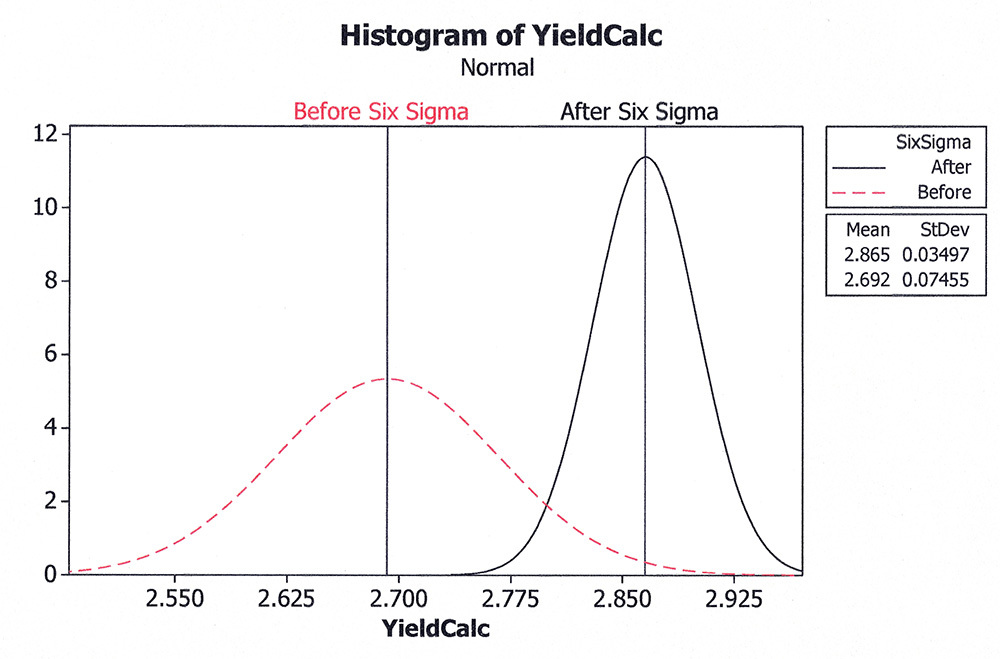
PHOTO: BBI INTERNATIONAL, SUSANNE RETKA SCHILL
February 14, 2013
BY James Frugé and Raul Gamboa
With corn costs comprising over 87 percent of the cost of ethanol production, a small improvement in corn-to-ethanol yield can have a large impact on plant profitability. Three reasons suggest why improvements don't always happen. First, ethanol producers in the past have mainly focused on throughput and have historically invested in projects that expand production. With the current oversupply and margin squeeze, producers are now being forced to focus on reducing production costs. Second, producers have difficulty accurately measuring yield without a lot of variability, and thus are not getting true measurements upon which to base improvement efforts. Third, many producers depend on a supplier’s technical support personnel to recommend optimum conditions for the use of products such as alpha amylase, gluco amylase, yeast, urea and ammonia. Producers often believe that by optimizing conditions for the use of these products, it will automatically result in maximum yield.
These three factors have resulted in less-than-maximum yield improvement. With current economic conditions changing production philosophy from production volume to low-cost production, the last two factors can be addressed by the use of Six Sigma process improvement tools.
The Six Sigma methodology was developed in the electronics industry in the 1990s at G.E., Westinghouse and Motorola. With the outstanding results achieved in this industry, Six Sigma was adopted by the petrochemical industry and others. Companies like Dow, DuPont, 3M, Celanese and other major chemical companies saved millions of dollars in applying the statistical and other Six Sigma tools to operating plants. Both the authors learned the methodology and experienced the savings while working in the petrochemical industry.
The Six Sigma method uses a road map for solving difficult problems such as yield optimization in the face of multiple variables, including the types of enzymes for both gluco and alpha, type of yeast, pH, temperatures of mix tank, temperatures of fermenters, solid concentration in the mash, urea addition rates, amount of backset, pH of backset, etc. Trying to optimize each of these variables for maximum yield is an extremely difficult, if not impossible, task without the use of advanced statistical tools.
Define, Measure, Analyze
Advertisement
Defining is the first step in the Six Sigma methodology. Defining is important because it assures agreement on what the problem is, what the process boundaries are, how to measure the results and who will be working on the project. Without that agreement, projects often suffer scope creep and are soon “trying to save the world.”
The measure step is where the team handles the problem of garbage in, garbage out. Without data, it is hard, if not impossible, to make good decisions. First, the team determines how well they can measure the output, also known as the Big Y. In the case of fermentation, yield involves measuring how much corn or milo was used in the fermenter batch, the ethanol in the final sample of fermentation, and how many gallons are in the fermenter. It sounds simple in principle but it can be difficult in practice. Many plants use high performance liquid chromatography (HPLC) to measure the amount of ethanol in the final or drop sample. The question arises, though, on how much variability from batch to batch is due to the variation of the process and how much is due to the measuring system (i.e. the HPLC). By analyzing samples in a prescribed way that represents the range normally seen in the process, the percent variation caused by the measuring system, the HPLC analysis, can be determined. For the measurement system to be good enough for process improvement work, the variability caused by the measurement system should be less than 30 percent of the variability of the process. The target is no more than 10 percent. The same technique can be used to reliably determine solid content in the mash measurement system.
Once these measurement systems have been proven to be good, they can be used to calculate a batch yield, the Big Y. One proprietary and trademarked method for measuring batch yield, called YieldCalc, has been developed by the authors.
The next part of the measure step is to determine the inputs (the little x’s) to measure, plus how well they can be measured. The assumption used is that all measurements are bad until proven otherwise. A process map created by the team identifies all of the inputs to the fermentation process, how they are measured and typical values. Then, a measurement system analysis (MSA) is performed on all of the inputs. In a typical plant there are approximately 85 to 100 inputs that need to be checked out.
Many times the MSA serves to verify the measurement is done correctly and stored in the correct place in the data system. This step requires the efforts of operators, maintenance technicians, management and just about everybody involved in running the process.
After making sure the data being used is good, the data collection on batches begins. It is important to not experiment with any of the variables at this time, since we are trying to determine the normal operation of the plant using good data. With all of the inputs captured and a batch yield calculated to show how well or poorly we did, the next step can begin.
In the analyze step, we use Minitab software to find the important input variables. Minitab is an intuitive statistical software package that has become the de facto standard for Six Sigma analysis. Some people use a package called Jump that also works well. First, a graphical analysis gives clues to which inputs have the greatest impact on yield and then statistical analysis determines which ones are most significant. In most processes with 85 to 100 inputs, only three or four have a high impact on the variability of the process. These critical few Big Xs will be unique to that particular plant. Even though all ICM and all Delta T plants have similar designs for the same overall ethanol capacity, there are differences that make each one unique.
Advertisement
Improve, Control
In the improve step, once the critical Big X inputs are known, we need to confirm their importance and identify any interactions by running a series of trials called a design of experiments (DOE). In a DOE, one runs the plant, varying the important inputs in a specific way, from a high value to a low value. Analysis of this data will confirm the importance of each variable and show how to best optimize the plant for maximum yield. Next, we set the important inputs at their optimum values and run the plant.
The control step is designed to make sure the improvements last. In order to improve the plant operations, one must change what one was doing before. Change is hard, however, and there is a tendency to go back to the old ways. The control plan is just a written plan for how we will be sure the important variables will be kept at their best values over the long term, and how to detect when things have drifted off before it is too late.
Results
Six Sigma was applied by the authors at a 50 MMgy ethanol plant where the yield was not what it needed to be and varied significantly from month to month. The plant operators also had a difficult time determining what impact, if any, a new enzyme or changed process condition had on yield due to the variability in the measurement.
Results of the project are shown in the two bell curves of the accompanying graph showing yield and standard deviation before and after. Yield was improved by 6 percent while the standard deviation was reduced by 52 percent. For a 50 MMgy plant, this yield improvement would result in over $7.5 million savings at a corn cost of $7 per bushel. The payback period for these projects typically ranges in the one- to three-month time frame, depending on the existing instrumentation and measurement systems.
The reduction in standard deviation of yield measurement allows plants to more accurately monitor the impact of new enzymes, yeast or new operating conditions on the most significant metric, yield. Thus, it helps with implementing further improvements as new technologies emerge in the ethanol industry.
Authors: James Frugé
Frugé Consulting.
214-477-5141
jfruge@mac.com
Raul Gamboa
Chemical Engineer, Consultant
214-697-0280
Raulutex1980@aol.com
Related Stories

Neste and FedEx, the world’s largest express cargo airline, have agreed on the supply of 8,800 metric tons (more than 3 million gallons) of blended Neste MY Sustainable Aviation Fuel to FedEx at Los Angeles International Airport (LAX).
The U.S. EPA on May 14 delivered two RFS rulemakings to the White House OMB, beginning the interagency review process. One rule focuses on RFS RVOs and the other focuses on a partial waiver of the 2024 cellulosic RVO.

The U.S. EPA on May 15 released data showing nearly 1.79 billion RINs were generated under the RFS in April, down from 2.09 million generated during the same month of last year. Total RIN generation for the first four months of 2025 was 7.12 billion.

Calumet Inc. on May 9 announced sustainable aviation fuel (SAF) capacity at its Montana Renewables biorefinery is expected to reach 120 MMgy to 150 MMgy sooner than previously reported for a fraction of the originally expected cost.
Tidewater Renewables on May 8 announced that its 3,000-barrel-per-day renewable diesel plant in Prince George, British Columbia, operated at 75% capacity during the first quarter, up from 71% during the same period of last year.
Upcoming Events


