ISU data shows profit shift from corn farmer, to ethanol producer

Don Hofstrand, AgMarketing Resource Center.
November 27, 2013
BY Susanne Retka Schill
Profits in the ethanol supply chain have shifted in recent months and now accrue to the ethanol producer instead of the corn farmer. Retired Iowa State University extension agricultural economist Don Hofstrand took a closer look at the numbers and the long-terms trends that are illustrated in the ISU economic model of a typical northern Iowa ethanol plant.
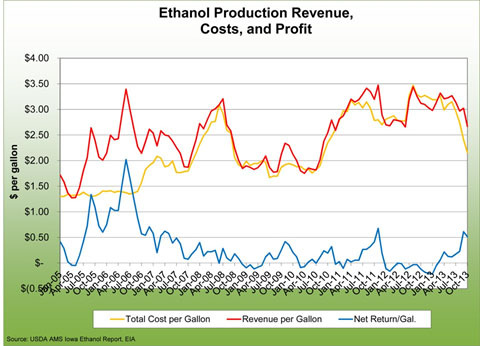
The model charts income and expenses using regional data, where applicable, and the fixed costs of a typical ethanol plant. Ethanol production costs peaked in August 2012, at $3.47 per gallon and dropped dramatically this year from $3.15 per gallon in June to $2.15 per gallon in October, attributed to declining corn prices.
Advertisement
Advertisement
With ethanol production cost dropping more rapidly than revenue, the model plant has seen a peak profit level of more than 50 cents per gallon, similar to a peak in late 2011. “However, several months of losses occurred between these two peaks,” Hofstrand points outs. “Although current profit levels are attractive, they are dwarfed by the enormous profit levels of 2006.” The accompanying chart illustrates the movement in ethanol production revenue, costs and profit.
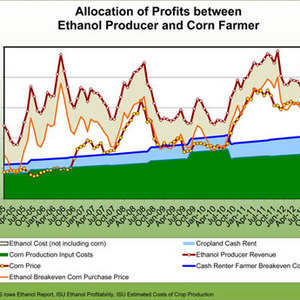
The second chart illustrates the allocation of profits between the ethanol producer and corn farmer. In the 12.5 years charts, Hoffstrand says, “the ethanol supply chain has displayed strong though volatile profitability over this period.” In the early years, the ethanol producer accrued more profits, while since 2008, corn price has tended to track the ethanol breakeven corn prices, “allocating supply chain profits to the corn farmer. If corn ethanol usage continues to expand, this trend may continue, because expanding ethanol production will continue to bid up corn price to ethanol production breakeven levels. However, if corn ethanol usage plateaus or declines, reduced demand for corn (at a time when corn production will probably continue to increase due to rising trend line corn yields) will result in lower corn prices resulting in an allocation of profits to the ethanol producer. It is even possible that corn price could decline even further (below cost of production). The cost of corn production does not adjust downward very quickly.”
Advertisement
Advertisement
The charts are updated monthly and can be found on the AgMarketing Resource Center website here. The economic model is a spreadsheet that can be downloaded and a specific ethanol plant’s values substituted in certain places.
Related Stories

CoBank’s latest quarterly research report, released July 10, highlights current uncertainty around the implementation of three biofuel policies, RFS RVOs, small refinery exemptions (SREs) and the 45Z clean fuels production tax credit.

The USDA significantly increased its estimate for 2025-’26 soybean oil use in biofuel production in its latest World Agricultural Supply and Demand Estimates report, released July 11. The outlook for soybean production was revised down.

The U.S. Energy Information Administration maintained its forecast for 2025 and 2026 biodiesel, renewable diesel and sustainable aviation fuel (SAF) production in its latest Short-Term Energy Outlook, released July 8.

XCF Global Inc. on July 10 shared its strategic plan to invest close to $1 billion in developing a network of SAF production facilities, expanding its U.S. footprint, and advancing its international growth strategy.

U.S. fuel ethanol capacity fell slightly in April, while biodiesel and renewable diesel capacity held steady, according to data released by the U.S. EIA on June 30. Feedstock consumption was down when compared to the previous month.
Upcoming Events


