USDA: November corn consumed for fuel ethanol up compared to 2015
January 10, 2017
BY Erin Krueger
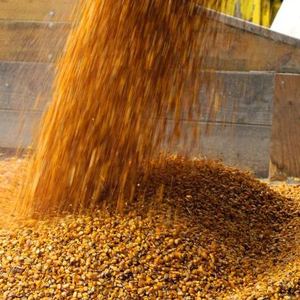
The USDA recently published the January edition of its Grain Crushings and Co-Products Production report, indicating total corn consumed for fuel alcohol was at 452 million bushels in November, down 1 percent when compared to October, but up 4 percent when compared to November 2015. Corn consumed for dry milling fuel production was at 90.2 percent in November, with 9.78 percent going to wet milling fuel production.
Sorghum consumed at dry mill plant was at 4,914 hundredweight (cwt) (275 tons), up from 4,519 cwt in October, but down from 5,615 cwt in November 2015.
At dry mills, condensed distillers solubles production was at 126,968 tons, down from 145,853 tons in October but up from 125,855 tons in November 2015. Corn oil production was at 147,189 tons, up from 141,775 tons in October 2016 and 129,786 tons in November 2015. Distillers dried grains production was at 423,892 tons, down from 448,355 tons in October 2016, but up from 413,019 tons in November of the previous year. Distillers dried grains with solubles production reached 1.96 million tons, up from 1.93 million tons in October and 1.9 million tons in November 2015. Distillers wet grains production was at 1.28 million tons, down slightly from October and up from 1.26 million tons in November of the previous year. Modified distillers wet grains production reached 389,038 tons, up from 376,028 tons in October, but down from 422,361 tons in November 2015.
At wet mills, corn germ meal production reached 63,635 tons, up from 58,988 tons in October, but down from 67,645 tons in November 2015. Corn gluten feed production was at 309,305 tons, down from 342,589 tons in October and 322,741 tons in November of the previous year. Corn gluten meal production was at 84,092 tons, down from 86,227 tons in October and 84,505 tons in November 2015. Corn oil production reached 49,393 tons, up from 47,860 tons in October, but down from 53,597 tons in November 2015. Wet corn gluten feed production reached 326,550 tons, up from 300,808 tons in October and 289,171 tons in November of the previous year.
Advertisement
Advertisement
Carbon dioxide captured at dry and wet mill plants reached 213,244 tons in November, up from 213,115 tons in October and 203,996 tons in November 2015.
Advertisement
Advertisement
Related Stories

CoBank’s latest quarterly research report, released July 10, highlights current uncertainty around the implementation of three biofuel policies, RFS RVOs, small refinery exemptions (SREs) and the 45Z clean fuels production tax credit.

The USDA significantly increased its estimate for 2025-’26 soybean oil use in biofuel production in its latest World Agricultural Supply and Demand Estimates report, released July 11. The outlook for soybean production was revised down.

The U.S. Energy Information Administration maintained its forecast for 2025 and 2026 biodiesel, renewable diesel and sustainable aviation fuel (SAF) production in its latest Short-Term Energy Outlook, released July 8.

XCF Global Inc. on July 10 shared its strategic plan to invest close to $1 billion in developing a network of SAF production facilities, expanding its U.S. footprint, and advancing its international growth strategy.

U.S. fuel ethanol capacity fell slightly in April, while biodiesel and renewable diesel capacity held steady, according to data released by the U.S. EIA on June 30. Feedstock consumption was down when compared to the previous month.
Upcoming Events


