Cashing In On Clean

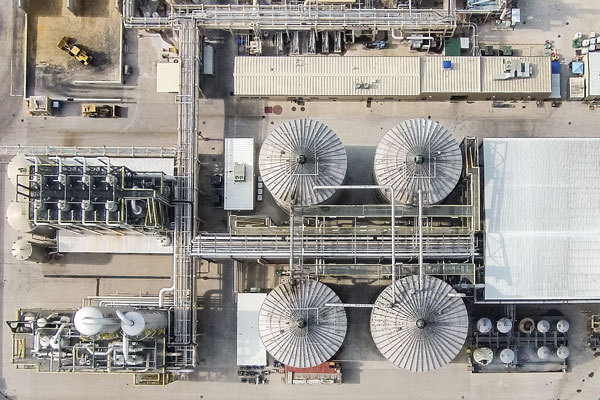
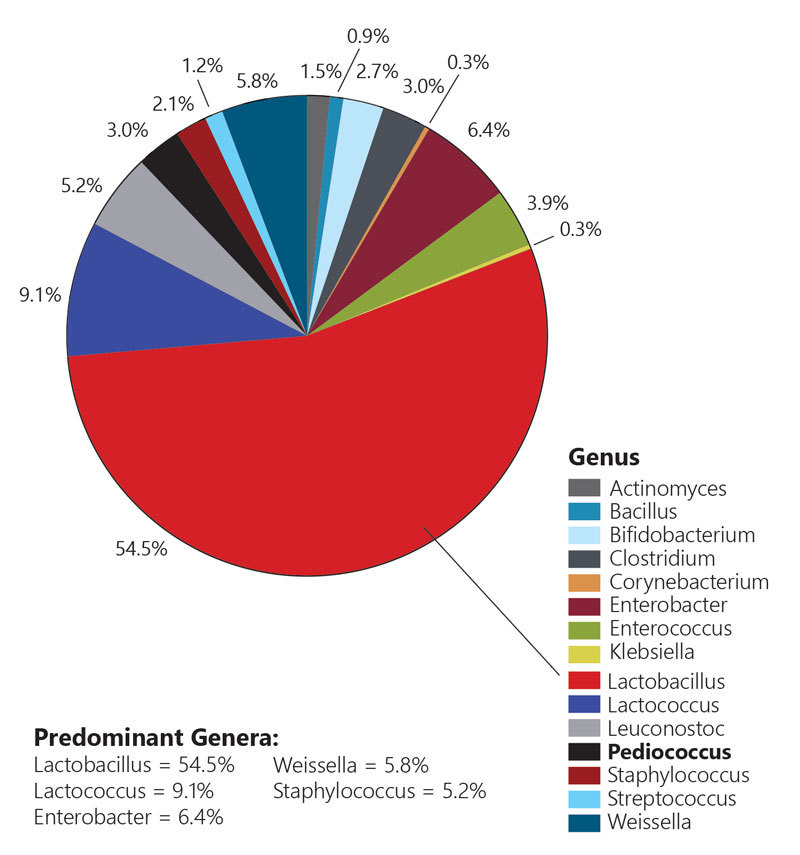
PHOTO: STOCK
January 16, 2023
BY Luke Geiver
Hygiene is an important and often overlooked part of plant operations, says Stephanie Gleason, Ph.D, and director of global technology for Phibro Ethanol. “By maintaining plant hygiene through an effective CIP and microbial control program, plants have the potential to reduce process upsets and production losses,” she says. Generally speaking, cleaner plants have fewer infections, higher yields, reduced inputs and decreased downtime.
While different clean-in-place and hygiene providers serving the industry have varrying means of keeping biorefineries clean, all agree that the financial benefits of their solutions far outweigh the associated costs.
Control What You Can
Gleason and her team are big proponents of controlling infections at the plant by establishing and monitoring a plant hygiene program. “Establishing a baseline for what is “standard” for the plant’s specific operations is essential in being able to identify and monitor problems.”
Establishing a program or even updating an existing program is a multi-step process. The early steps involve creating a program for monitoring contamination in the plant, a job that requires a look at the plant’s baseline hygiene and the effectiveness of current microbial control methods. To set a baseline for a facility, evaluations of organic acid in multiple processes have to happen, specifically for prop and ferm profiles, early ferm and drop and delta organic acid production. A review of past and current data should look at environmental conditions such as temperatures and pH levels throughout the plant. Process variables to consider include nitrogen additions. Profiles of fermentation sugars and ethanol are also important.
“The simple goal is to be able to quickly establish deviations from the baseline and take corrective action,” Gleason says.
Phibro’s team estimates that contaminated fermentations (one of the main sources where dirty plant elements show up) can result in reduced yields. For a 1 percent loss of yield due to infection, it could cost a plant more than $2,000 per ferm, not including any downstream processing problems due to high residual sugars. The most common genus of infection types is lactobacillus—accounting for more than 50 percent of infections—followed by lactococcus at 9.1 percent.
Phibro puts contamination into three levels: low, mid and high. At the low level, there is little to no change in analytical measurements, limited change in performance but an increase in microbial load. At the mid-level, there are measurable changes to drop ethanol and sugars, as well as yield. Organic acid concentration increases on HPLC monitoring as well. And at the highest level of contamination, there are significant increases in the drop sugars and organic acids. Productivity is noticeably reduced, along with process efficiency and, most importantly, yield.
Gleason reminds producers that ethanol plants are not typically sterile environments. There is almost always a background level of contamination in the plant, so it becomes about control and limiting opportunities for contaminations to cause infection events.
In general, a plant benefits with an effective hygiene program in a multitude of ways. Reduced infections create less yeast stress. Reduced yeast stress creates higher titers, lower sugar drops and increased productivity. It also promotes less competition for micro- and macro-nutrients along with decreased recycling of inhibitory metabolites.
Then, there is reduced carbon loss from excess organic acid formation, improved heat transfer across unit operations and lower energy inputs (from less steam needed). A good program will also extend the time between major cleaning events, reducing that annual cost.
“These benefits have the potential to lead to higher yields, reduced inputs and decreased downtime for plants,” Gleason says.
The Phibro team helps provide guidance on sample collection and locations to form a baseline in an ethanol plant. Gleason and her team analyze and interpret the fermentation data. The team also helps plants identify areas to monitor including key process areas, visual and tactile inspections and specialized imaging.
Through its diagnostic kits, the Phibro Ethanol team helps plants troubleshoot infections and identify sources of contamination in the process.
“At Phibro Ethanol we have a philosophy,” Gleason says. “Get clean. Stay clean.”
Cleaning for The Bottom Line
Ryan Brock, technical services manager for Lallemand Biofuels and Distilled Spirits, says that it costs significantly more to ignore hygiene problems or react to infections than to have a robust maintenance program established for a production facility. “Companies that put focus on hygiene have fewer costly events and much less downtime as a result,” Brock says.
The numbers of a monthly cleaning program prove Brock’s point. For a standard caustic CIP, the standard bulk delivery of cleaning products ranges between $0.16/lb to $0.24/lb. Bulk deliveries of products comes in via truckload, typically ranging from $19,000 to $64,000 in cost. Some plants get three loads per month, others get six. Additional costs can be added if antibiotic maintenance dosing products are added. Depending on the ferm runs that are treated, these costs can range from a negligible $90/day to as much as $2,880/day.
The breakdown for monthly maintenance costs, according to Brock, is as follows. Monthly caustic costs run from $20,000 to $65,000 per month. Monthly antibiotic expenses range from $2,700 to $90,000 per month. Total monthly expenses, which depend on plant size, run rates, hygiene practices and equipment onsite, can range in cost from $23,000 to $155,00 per month.
For Brock and his team, they see and treat infections in the mash trains, fill header (single loop) and beerwell. “Most people ignore infections here (beerwell),” he says, and consider it the trash can. After fermentation, bacteria present there can get back into fermentation through various means, “so it is still important to clean,” because lactic acid recycling inhibits future fermentations and bacteria steal nutrients that could remain in process for future generations.
To prove his point on the value of maintaining a clean fermentation process, Brock lays out this scenario based on results his team has seen or worked with. If a dirty fermentation of 12.5 weight/volume percentage is allowed, it will produce a fermentation working volume of 116,297 gal/ferm. If that ferm is made clean, it can reach 14.5 weight/volume percentage and make 137,658 gal/ferm. At $2.00/gal ethanol, the difference between the two scenarios is $42,722 per ferm (achieved on the high end by avoiding the loss of 21,361 gallons per ferm). At 8-hour fill times, that equates to $128,000/day in loss. So, as Brock and his team put it, should a plant invest in maintenance and CIP protocols or react to a problem when it happens? The CIP investment will run between $23,000 to $155,000 per month. The scenario described above equates to a total monthly infection loss ($128,000 x 30 days) of more than $3.8 million/month.
For plants looking at improving CIP, Brock says there are actions that are essentially “free” and others that cost but have advantages. The “freebies” include establishing a plant cleaning schedule, updating standard operating procedures (SOPs), inspecting lines, monitoring spray balls, double checking pressures and temps manually and checking samples on HPLC. The options that come with a price include repair or replacing failing equipment, removing deadlegs, bleaching sumps or the beerwell, lowering the beerwell level and CIPing the top, cleaning out caustic tanks, upgrading CIP pumps or adding boosters, and cleaning out the whole stillage/PC.
Optimizing Your CIP Program
Mark Altier, senior program leader for Ecolab RD&E, helps lead a team focused on water, hygiene and infection prevention solutions and services. Ecolab can provide CIP solutions for several areas of an ethanol plant, including the distillation, liquefaction, evaporation/drying or fermentation areas. Altier’s team has created satellite CIP systems and central CIP options.
The satellite systems can be placed throughout a facility, providing flexibility and giving the plant unique application options, with some additional equipment management. The Central CIP approach provided by Ecolab includes a large, centrally-located single unit that provides a better efficiency of scale. It’s a more simple system but it doesn’t come with as much flexibility or unique ability as the satellite units.
In general, Altier says that optimizing CIP practices is not a “more is better” scenario. With CIP, every plant is different and there is no one-size-fits-all approach. Optimization, he says, can lower overall operational costs.
To provide CIP optimization, Ecolab focuses on several factors, including: reducing cleaning time; increasing production uptime; cleaning more effectively; driving throughput; consistency in the cleaning program; servicing and auditing for optimal performance and maintenance and lastly; reducing total operating costs.
Ecolab has had success with heated surface pretreatment technology used in the evaporation/drying areas along with the liquefaction portion of the plant. Using a penetrating pretreatment chemistry over the surfaces, an alkaline override reaction takes place and helps remove soil and other unwanted deposits from the surface. The result of the process is a significant improvement in cleaning effectiveness and time. Other areas that have benefited from Ecolab’s total plant cleaning approach include the syrup line, disk stack centrifuges and tricanter.
Working with a producer, Ecolab was able to provide several benefits related to the evaporator. The numbers tell the story. The team took a standard CIP time of 16 hours down to 4.25 hours (11.75 hours saved per week). The CIP changes involved removing cleaning acid, reducing hydroblasting, increasing corn oil efficiency, improving pressure differentials and increasing ethanol production. The corn oil production additions brought nearly $100,000 to the plant and the elimination of hydroblasting saved the plant roughly $160,000 annually.
On the fermentation side, Ecolab has found success with low pH cleaning programs designed specifically for a fermentation environment. The approach puts less chemicals into the fermentation cycle. The products used are also recognized as safe for animals. The product lineup includes three components: Trimeta Advance for build alkaline, Trimeta Dynamic to act as a detergent booster, and Trimeta Armor for a final rinse.
For any plant looking to enhance its CIP program, Altier says there are considerations to look at right away. Materials used in construction matter, along with foam characteristics where liquids are involved. Vertical or horizontal dead legs should be avoided, along with product holdup in lines and equipment. The correct spray ball design and configuration should also be optimized. “Every plant is different,” he says. “Ecolab can help build a program that meets your unique needs.”
Author: Luke Geiver
Contact: editor@bbiinternational.com
Advertisement
Advertisement
Advertisement
Advertisement
Related Stories
FutureFuel Corp. on March 26 announced the restart of its 59 MMgy biodiesel plant in Batesville, Arkansas. The company’s annual report, released April 4, indicates biodiesel production was down 24% last year when compared to 2023.

Neste has started producing SAF at its renewable products refinery in Rotterdam. The refinery has been modified to enable Neste to produce up to 500,000 tons of SAF per year. Neste’s global SAF production capacity is now 1.5 million tons.

Tidewater Renewables Ltd. has reported that its biorefinery in Prince George, British Columbia, operated at 88% capacity last year. A final investment decision on the company’s proposed SAF project is expected by year end.
Tidewater Renewables Ltd. has reported there was a minor fire on April 1 in the main renewable diesel process unit at the corporation's renewable diesel refinery located in Prince George, British Columbia.
Nearly 1.52 billion RINs were generated under the RFS in February, down more than 25% when compared to the 2.04 billion that were generated during the same month of last year, according to data released by the U.S. EPA on March 20.
Upcoming Events


