Workable Volatility

May 22, 2022
BY Susanne Retka Schill
Whiplash may be the newest occupational hazard for ethanol producers these days given the volatility in margins and markets and a string of black swan events.
Black swan events are rare, totally unpredictable events with severe consequences. Think Covid. Think Ukraine war. Scott Irwin goes back even further. “The first one was the trade war with China. Then you got the sudden huge return of China buying U.S. commodities in the second half of 2020. Then you had the pandemic, where the bottom fell out of everything. Then all the uncertainties in recovering from that, like what happened with ethanol in 2021, which was very positive. Now in March of 2022, the closest thing to an outbreak of World War III since the 1962 Cuban missile crisis.” These extraordinary, outside events laid on top of the normal volatility caused by weather concerns have created a perfect storm for volatility, Irwin says. “It would be nice if things calmed down for a while.”
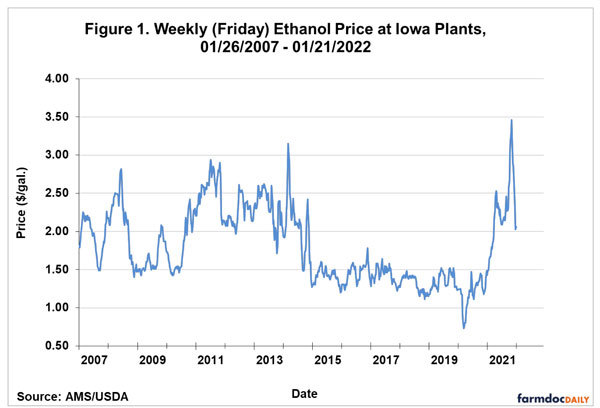
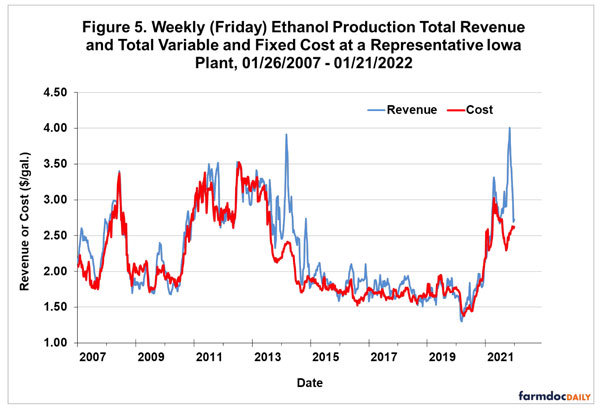
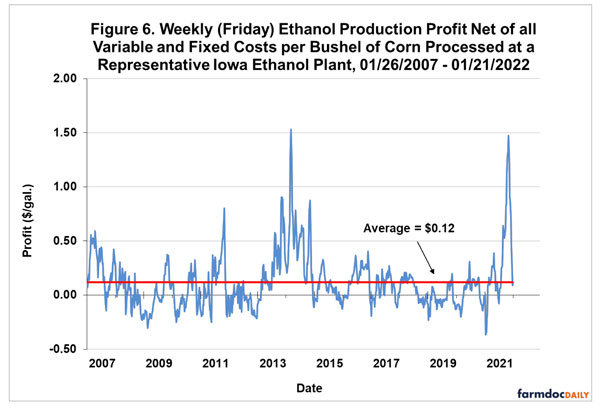
As an ag economist at the University of Illinois-Urbana Champaign, Irwin tracks markets and evaluates ethanol margins using a representative Iowa-based ethanol plant. (See accompanying figures showing historical prices and relationships.) After a spike in profitability in 2013-’14, the industry has operated on small average profits, fluctuating between moderate profits and moderate losses, he says. “That’s how the industry operated from 2015 until the pandemic hit, with an average of just over 10 cents a gallon net profit over variable and fixed costs.”
After almost six years of slim pickings, ethanol profitability exploded in the second half of 2021 as U.S. driving and gasoline consumption recovered to pre-pandemic levels. “Exactly during the period when driving was ramping up and gasoline use was recovering, we got this odd downward blip in ethanol production relative to trend,” Irwin says. He suspects there is a benign reason, such as ethanol plants concentrating maintenance in this time block, thinking gasoline use wasn’t going to recover as fast as it did.
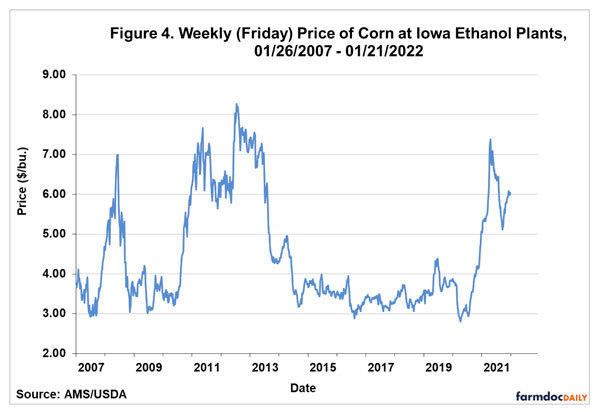
Ethanol production recovered quickly and within a month, prices started retreating from the high. “Now everything is much closer to normal,” Irwin says. “The industry is profitable, based on computations through the first week of March.” Just before press time in mid-April, Irwin said ethanol production profits remained positive throughout March and the first two weeks of April, despite the proximity of $7 or $8 corn. The average net profit after all variable and fixed costs—based on his model of a representative Iowa ethanol plant—was 22 cents per gallon, 10 cents higher than the long-term average of 12 cents per gallon.
Benchmarking Snapshot
While Irwin’s analysis uses a representative Iowa plant to project broad industry averages for analysis, Christianson Benchmarking provides a snapshot into actual plant data. Plants sharing their data in the program represent roughly a quarter of the industry in a full range of plant sizes and both single and multi-plant ownership structures.
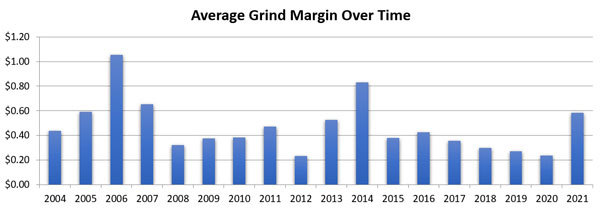
Connie Lindstrom, senior analyst at Christianson Benchmarking, suggests looking at grind margin as a means of evaluating the industry’s profit potential by focusing on just the commodity price relationships. In the Christianson analysis, grind margin is defined as ethanol and coproduct netbacks on a per-gallon basis, minus the cost of denaturant, corn and energy. All other operating expenses range between 20 and 30 cents per gallon, Lindstrom says.
Looking historically at the actual benchmarking data (see chart on page 30), the average grind margin of over $1 a gallon in 2006 drove the industry’s expansion. Expanding ethanol supplies and higher corn prices then depressed grind margins, hitting a low during the drought of 2012. The generous grind margin in 2014 was followed by a steady downturn until last year’s spike.
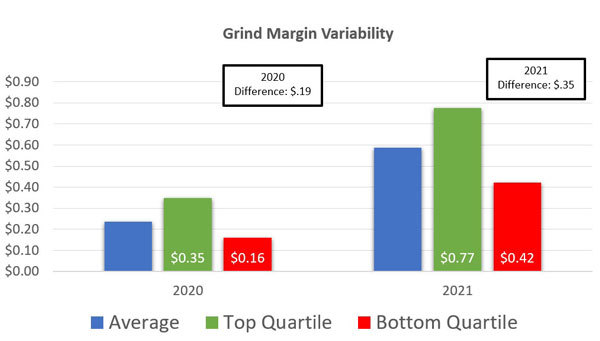
There’s a danger in looking at averages, Lindstrom adds. “In any given year there will be winners as well as plants facing challenges: proximity to feedstock, marketing relationships, efficiencies, even labor force and part-supply chain issues can all come into play in determining overall profitability,” she says. “In higher-profit times the gap between a high-performing plant and a less profitable one tends to grow. Both 2020 and 2021 are interesting. In 2020, the top-quartile average grind margin—the “leaders”—was 35 cents. In 2021, the difference between the top quartile and the bottom quartile—the “laggards”—was that same amount, 35 cents.” (See chart on page 32).
“Riding the waves of commodity price fluctuation is a sport most producers are familiar with from their backgrounds as farmers,” Lindstrom says. “Ethanol producers have seen this before—they are savvy enough to use relatively higher-profit times to reinvest, make enhancements and improvements, build collaborative relationships and ready themselves to ride out the next inevitable slump.”
Ag economist Chad Hart, at Iowa State University, agrees that volatility is nothing new. “We’ve seen this before. These plant managers do know how to manage through these times.” Recently, he says, producers utilized the increased profits to book corn deeper into the future. “Over the past six to eight months, we saw the ethanol industry become some of the more aggressive bidders for corn, and not only in the spot market, but also deferred pricing.”
Hart also is seeing more collaborations develop. “We’ve also seen our industry look to set up greater storage partnerships with local elevators and co-ops so they can rely on crop storage facilities of their partners to help them balance some of the swings within the commodity markets.”
Coproduct, Corn Outlooks
Covid threw a curve into commodity crop prices just as it did elsewhere in the economy, Hart says. “As Covid hit, there was a tremendous pull on the agriculture markets coming from the international markets. I described it as ag having its own sort of global toilet paper episode.” The fear everything would shut down resulted in panicked buying. But ag products continued to flow and 2020 saw record quantities exported. Although the quantities backed down a bit in 2021, commodity price increases boosted export values to new records. “An export surge has been driving the price structure across commodities these last couple of years,” Hart says. “Biofuels, specifically ethanol, has been at the whim of those movements, as opposed to leading.”
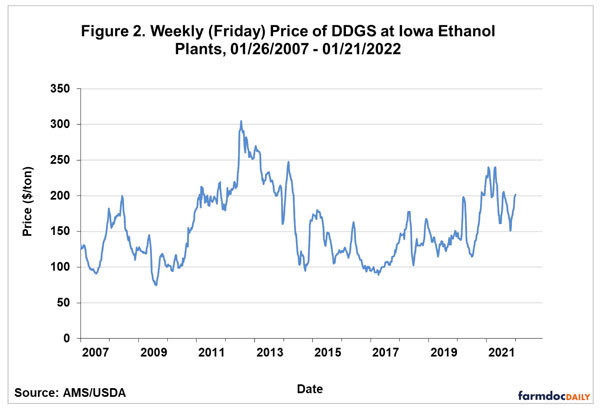
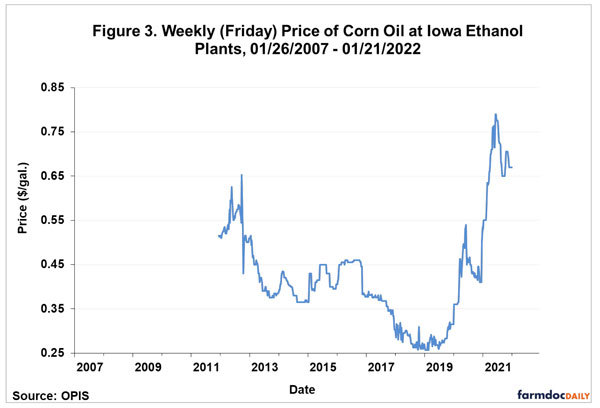
Looking at ethanol’s coproducts, corn oil’s dramatic price increase is following a dramatic price increase in all vegetable oils, partly due to global demand for vegetable oils alongside domestic demand for those oils for renewable diesel, Hart says. Where in the past, soybean meal demand drove the market and soy oil the residual, that has now flipped. (The rule of thumb is that a bushel of soybeans yields about 17-18 pounds of oil and 40-some pounds of meal.) The resulting generous supplies of soybean meal impacted distillers grains, he continues. “When oil prices first took off, we saw lower soybean meal prices, and that put pressure on distillers grains prices.” As corn prices have increased, the feed market for soybean meal and distillers grains have seen a strong recovery.
Those higher corn prices, of course, are putting a squeeze on ethanol margins even as the ethanol market appears to be shifting back to tracking crude oil. “In the beginning, ethanol had to be tied to oil, we had to be competitive in the energy markets in order for the industry to survive,” Hart says. “Once the industry got large enough to be viable, then you could argue ethanol prices tended to track corn.” Last year’s higher ethanol margins were driven more by oil than corn, he says, which is continuing this year as gasoline markets react to what’s happening globally.
Today, the ethanol market is back to keeping an eye on oil, while keeping the other eye on corn, seeking a balance. “We need to have a strong enough signal from energy markets to help support what we may face in the ag market. Or to put it another way, ethanol can only pay for corn what the gasoline market will allow it to do,” Hart says.
Global Impacts
“The war in the Black Sea region is both an energy issue and an agricultural issue,” Hart continues. By raising prices across the board, the higher energy prices are both a positive for ethanol prices and a negative for energy inputs, with increasing ag prices pinching the ethanol margin.
As spring planting approached, the grain markets were trying to figure out what the Ukraine war would mean for crops in that region and domestically. Ukraine being a major regional winter wheat supplier, coupled with continued drought in the western U.S., is likely to keep winter wheat prices high relative to corn and soybeans. Hart says he expects the wild card will be the potential for double cropping with winter wheat in the central parts of the U.S., with high fertilizer costs favoring beans over corn for the summer crop.
The March 31 USDA Prospective Plantings report supported Hart’s theory showing projected soybean acreage up 4 percent and corn planted acreage down 4 percent from 2021. In its February Ag Outlook Forum, USDA put projected yield at 181 bushels per acre, which at the prospective 89.5 million acres would produce about 14.8 billion bushels—roughly matching corn usage in 2020 and 2021 marketing years, Hart says.
Corn futures were bullish after Russia’s invasion of Ukraine, jumping to a mid $7 range. USDA’s April WASDE report projected higher foreign corn production with increases for Brazil, Indonesia, Pakistan and the EU. USDA projected a national season average farm corn price of $5.80 in the April report, up from $5.65 in the March report, which hadn’t totally reflected the Ukraine war, and up $1.30 from the prior year.
Natural Gas
Bullish sentiment is affecting all commodities, including natural gas, says Andy Huenefeld, director of energy price risk at World Kinect Energy Services. While volatility in the winter months is a common reaction to periods of cold weather, the volatility and market highs this spring were disconnected from the fundamentals. “It’s more of a financially driven rally—market forces and additional buying interest and bullish sentiment in the financial markets—all working to increase price.” Spot markets were up, but not rallying to the same degree as the futures, he adds.
Concerns about European natural gas supplies from Russia are having a psychological impact on U.S. markets, Huenefeld continues. But while the U.S. does export to the EU, he points out we are exporting as much as possible right now and bringing any new export capacity online would take a minimum of three years, if not five.
In the near term, the outlook for natural gas production looks a lot more favorable than in recent years. “We have real signs of producers responding to higher markets and expanding gas production,” Huenefeld explains. “That was one of the big drivers of higher prices last year, because producers weren’t responding and increasing output like we might have expected. This year they are.” He does not, however, expect prices to return to the low levels of the past. “I think we’ll eventually find an equilibrium where gas producers can make a nice profit and keep growing output and the gas prices aren’t so high as to put a burden on the wider economy.”
Author: Susanne Retka Schill
Contact: editor@bbiinternational.com
Advertisement
Advertisement
Related Stories

The Michigan Advanced Biofuels Coalition and Green Marine are partnering to accelerating adoption of sustainable biofuels to improve air quality and reduce GHG emissions in Michigan and across the Great Lakes and St. Lawrence Seaway.

The U.S. Energy Information Administration reduced its 2025 forecasts for renewable diesel and biodiesel in its latest Short-Term Energy Outlook, released April 10. The outlook for “other biofuel” production, which includes SAF, was raised.
FutureFuel Corp. on March 26 announced the restart of its 59 MMgy biodiesel plant in Batesville, Arkansas. The company’s annual report, released April 4, indicates biodiesel production was down 24% last year when compared to 2023.

Neste has started producing SAF at its renewable products refinery in Rotterdam. The refinery has been modified to enable Neste to produce up to 500,000 tons of SAF per year. Neste’s global SAF production capacity is now 1.5 million tons.

Tidewater Renewables Ltd. has reported that its biorefinery in Prince George, British Columbia, operated at 88% capacity last year. A final investment decision on the company’s proposed SAF project is expected by year end.
Upcoming Events


